Solana Primed for Explosive Rally—$240 Breakout Looms

Solana’s chart is screaming bullish. After weeks of consolidation, SOL’s technical setup hints at an impulsive leg up—targeting that $240 resistance like a laser. Here’s why traders are loading up.
The breakout blueprint: Symmetrical triangle formation complete, RSI shrugging off overbought fears, and volume creeping upward. Classic runway for a volatile move.
Watch these levels: A clean hold above $180 opens the floodgates. Institutional money—always late to the party—is finally sniffing around ’Ethereum’s faster, cheaper cousin.’
Bottom line: The algos are hungry, retail FOMO is brewing, and your broker’s ’risk management’ email will hit inboxes approximately 15 minutes after the 30% pump. Trade accordingly.
Key technical points
- Support Holding at 0.618 Fibonacci: Price bounced off the 0.618 retracement level, which is in technical confluence with VWAP SR and a key swing low, reaffirming this zone as a high-probability demand area.
- Point of Control & 200-Day MA Resistance: The $176 level, which confluences the Point of Control and the 200-day Moving Average, has acted as short-term resistance. A break above this level could spark a sharp expansion.
- Accumulation Range Forming: Price action has been consolidating tightly within a range, suggesting equilibrium between buyers and sellers. These conditions typically precede breakout moves in trending markets.
- Stochastics RSI Bullish Cross: The Stochastics RSI is confirming a bullish crossover from the oversold territory, historically preceding strong momentum shifts on Solana.
- Full Market Rotation Target at $240: A continuation from current levels would fulfill a full market auction theory — rotating from high-timeframe support toward resistance at $240, the value area high.
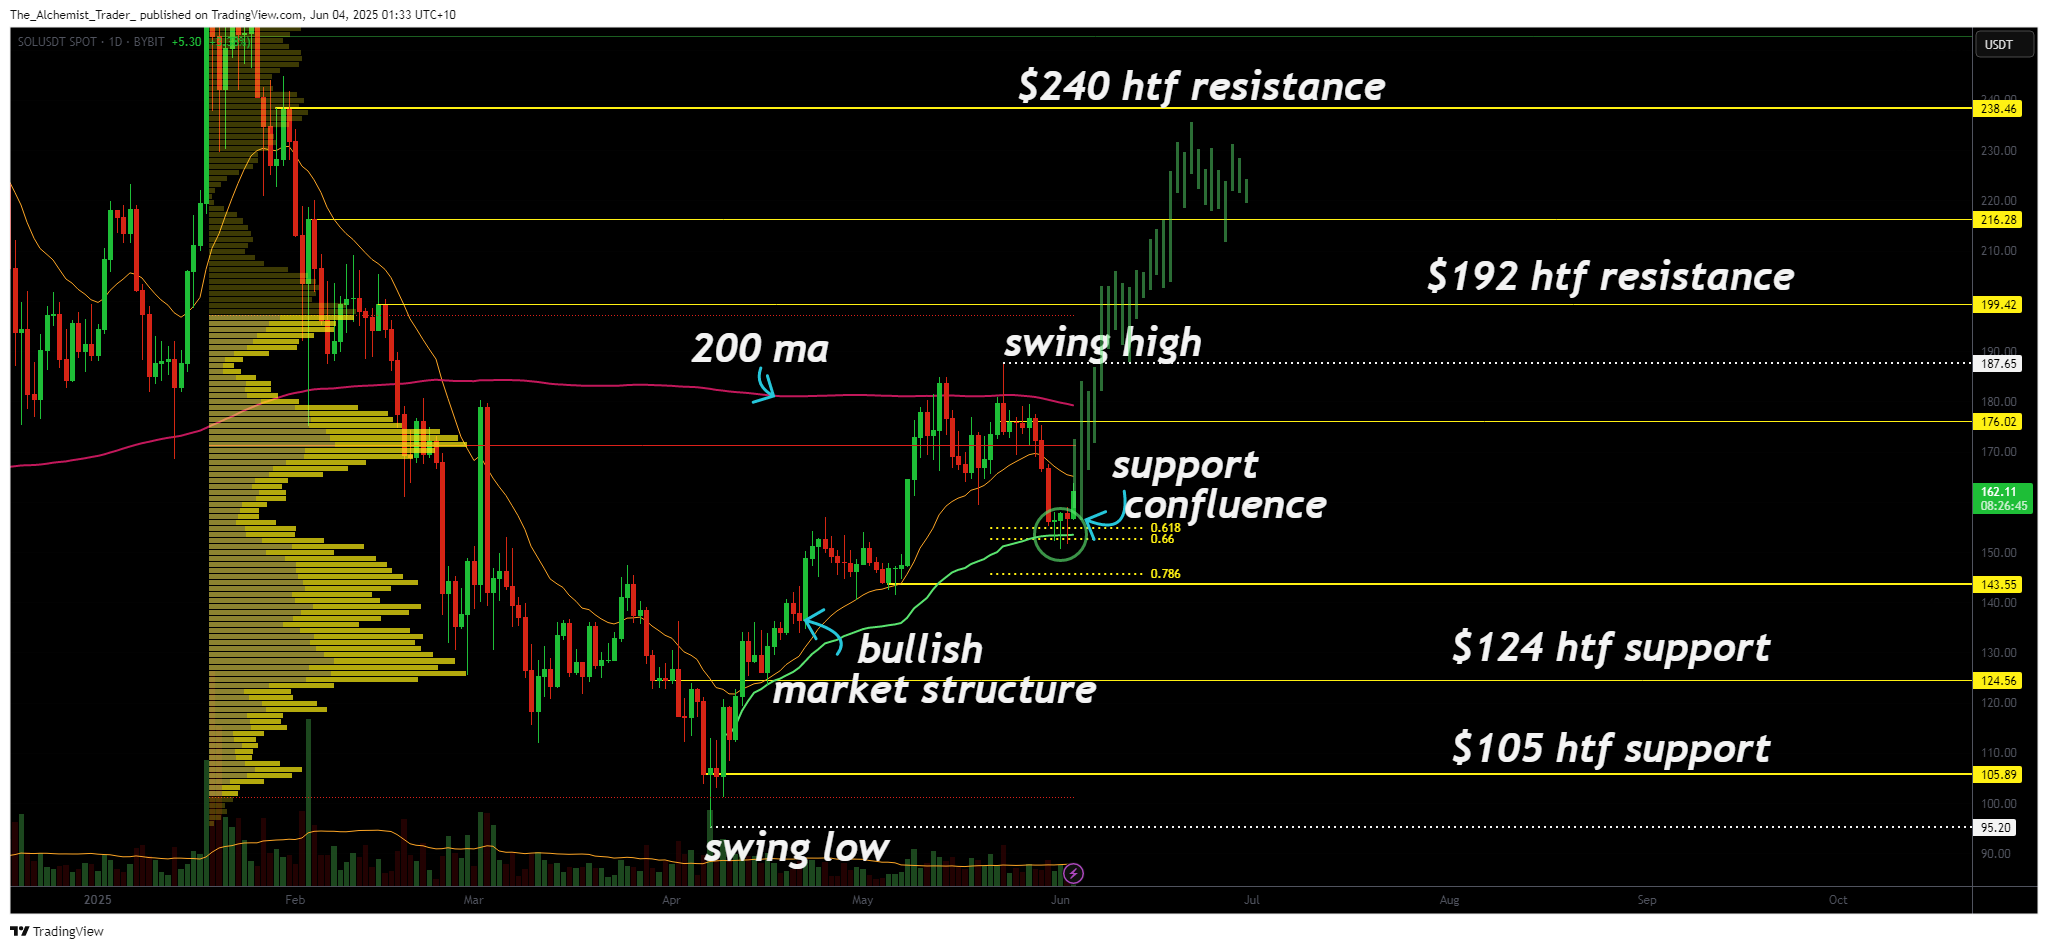
Solana’s recent price action supports the case for bullish continuation. After rallying from its established market low, Solana faced rejection at $176, a resistance zone defined by the 200-day Moving Average and the Point of Control. The subsequent pullback did not break critical support. Instead, price found demand at the 0.618 Fibonacci retracement level, aligning with VWAP SR and a prior swing low.
This confluence around the $156–$160 zone marks a key decision area. The bounce from this region has produced strong daily candle formations, including bullish engulfing patterns, which often signal the beginning of expansion phases.
The current consolidation has developed into a tight range with multiple daily wicks rejecting lower prices—implying that buyers are absorbing sell pressure. In the context of an uptrend, such price action typically forms a base before the next breakout.
A strong close above $176 WOULD confirm a breakout and likely lead to a retest of the psychological $200 level, followed by the high-timeframe target at $240.
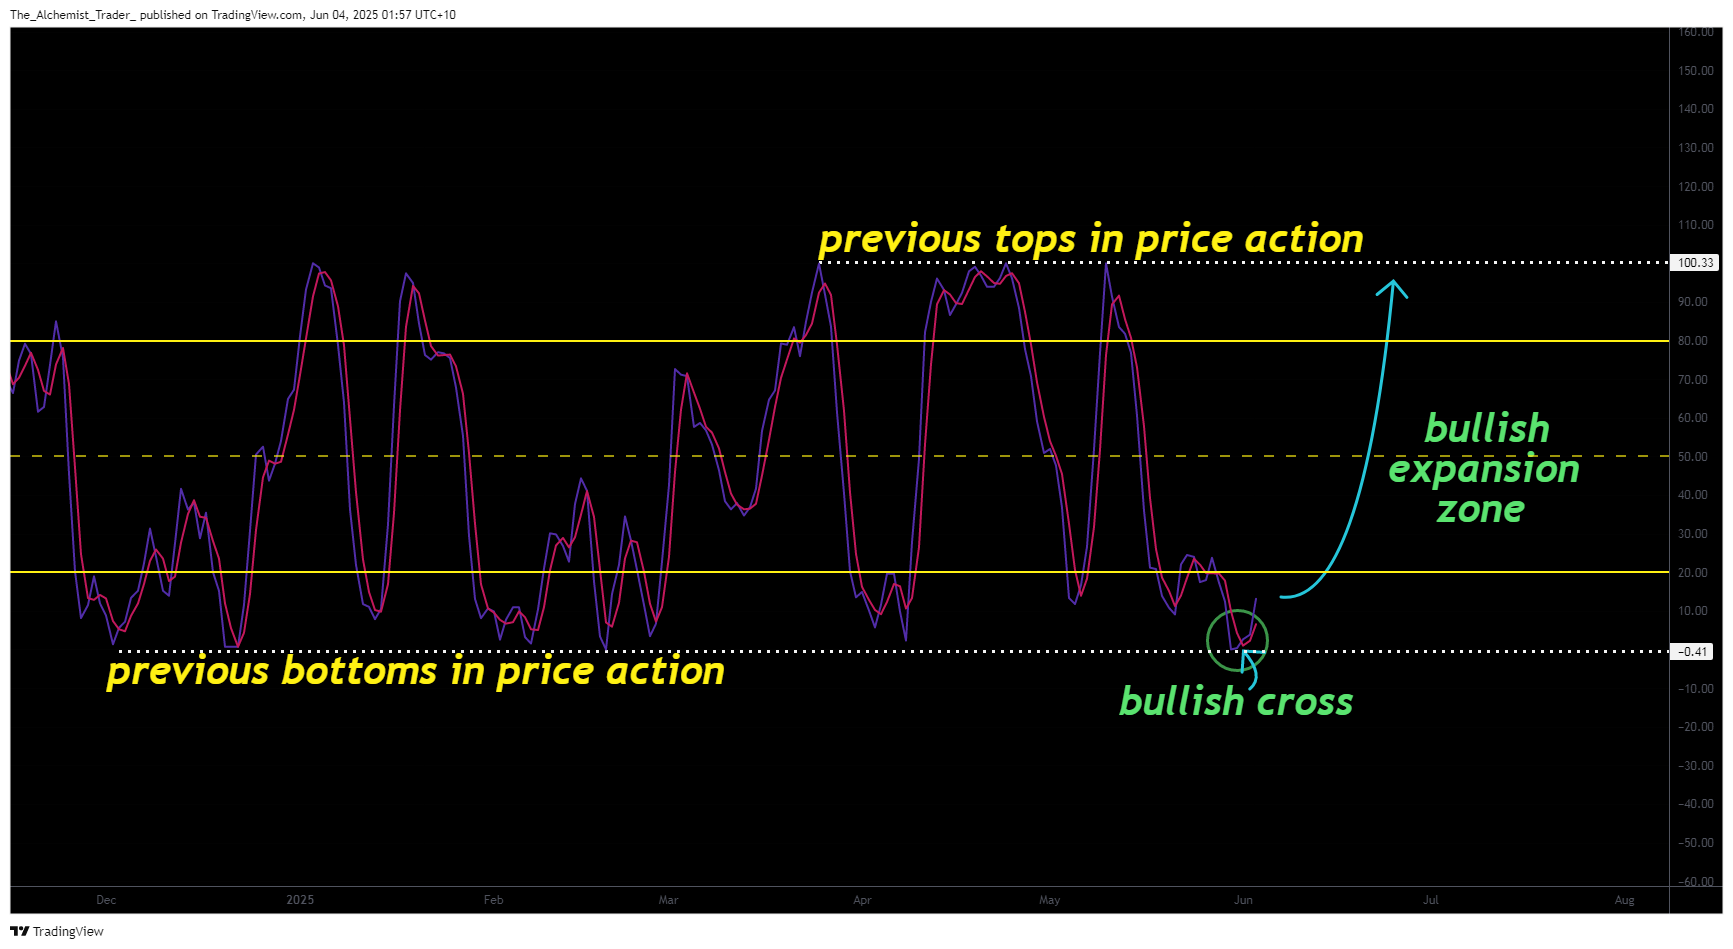
The Stochastics RSI further supports the bullish narrative. It has recently crossed bullishly from oversold levels and is curving higher—a technical signal that has preceded rally phases in previous Solana cycles. Historically, when the Stochastics RSI reclaims the 20-level after a bullish cross at local lows, Solana often enters a strong upward trend. This indicator should be monitored for continuation to confirm the likelihood of a breakout.
Additionally, volume has slightly declined during this consolidation phase, an expected characteristic of accumulation. A breakout accompanied by rising volume would validate the bullish outlook and signal the start of the next impulsive move.
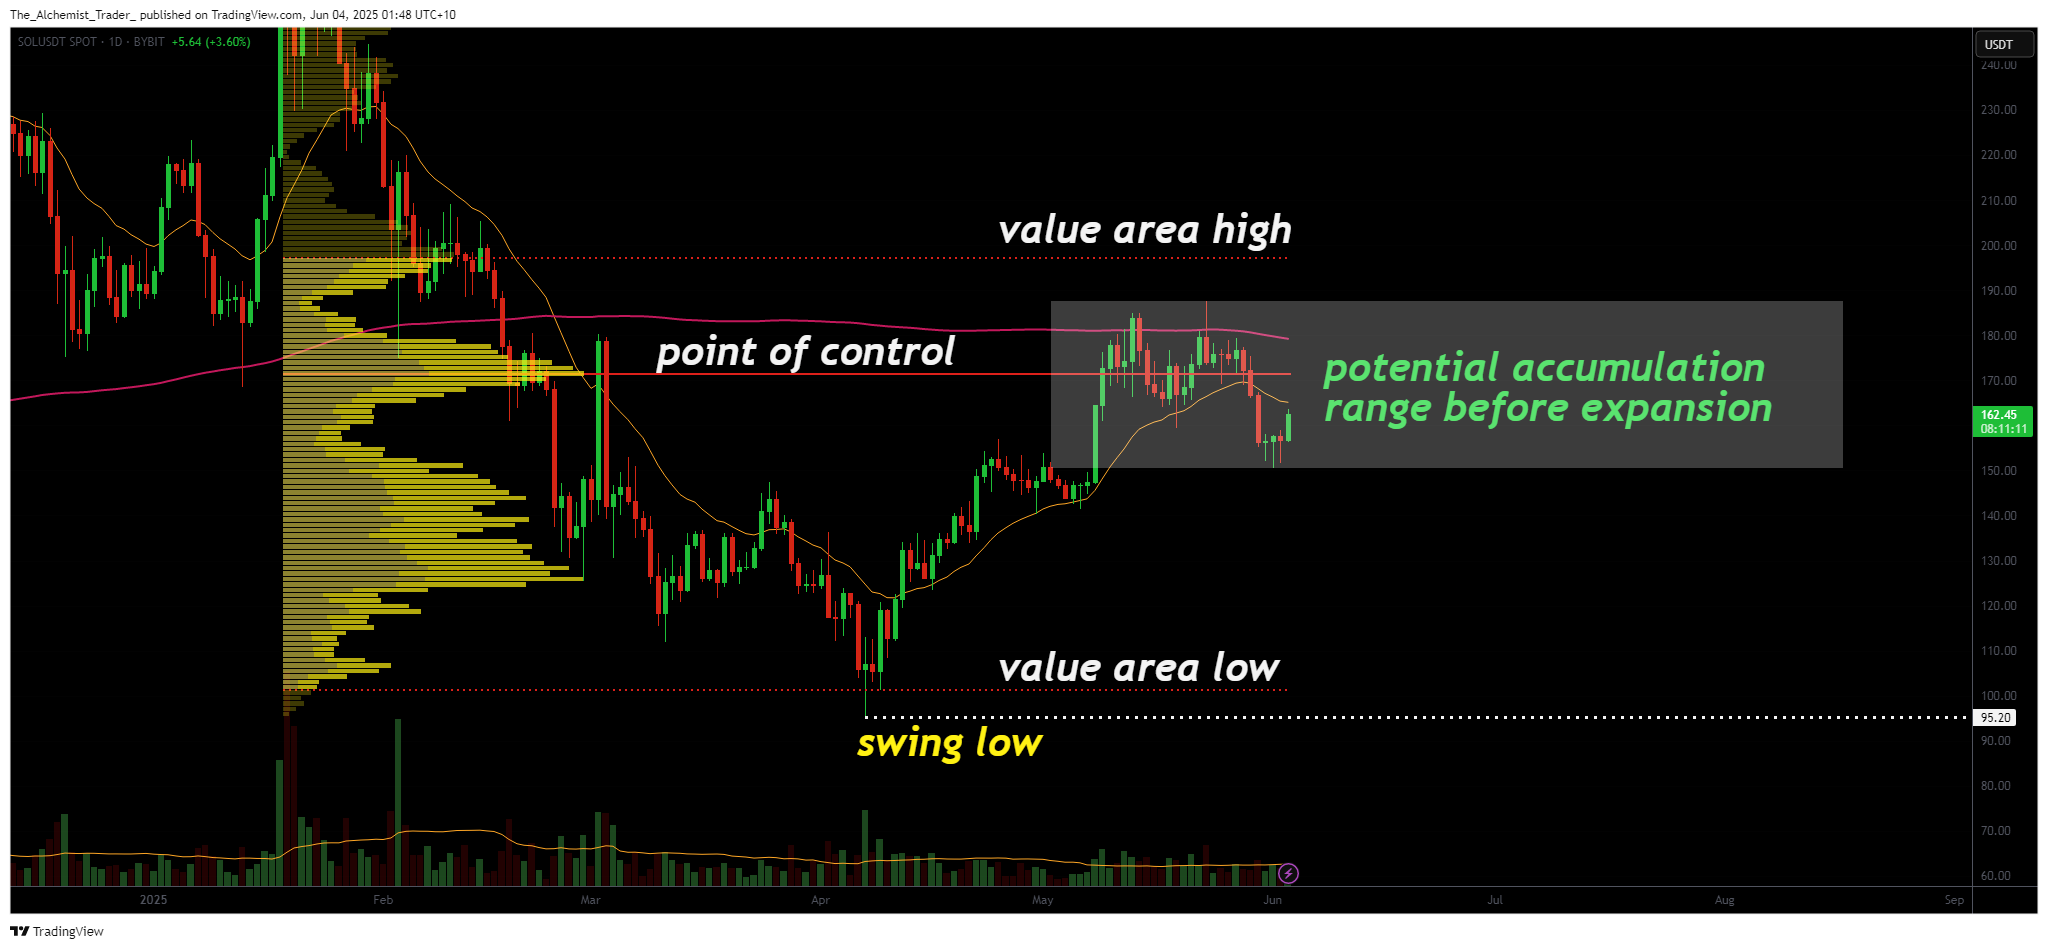
Solana’s current trading activity aligns with Market Auction Theory. After establishing a value area low during a broader correction, price rotated upward toward the Point of Control, the level representing fair value by volume.
The subsequent correction served as a retest of value acceptance, with price now resting above both the 0.618 Fibonacci and VWAP, areas that previously acted as breakout zones. According to auction theory, confirmation above mid-range levels like the Point of Control often precedes a full rotation to the value area high—currently located NEAR $240.
This projection also aligns with measured move calculations based on prior impulsive legs, reinforcing the case for further upside if structure remains intact.
What to expect in the coming price action
Solana is currently trading within a consolidation range that may be laying the groundwork for its next MOVE higher. The critical level to watch is the $176 resistance. A daily close above this zone, particularly with rising volume, would likely confirm a breakout and open the path toward $200, followed by the $240 value area high.
On the downside, failure to hold the 0.618 Fib support would not immediately invalidate the bullish outlook but could lead to extended consolidation or a retest of the $148–$150 zone.
Given the strength of the current market structure, momentum signals, and volume context, the odds favor a bullish breakout in the immediate to near term. Traders should watch volume and lower time frame confirmations closely as Solana approaches this key inflection point.
