Pepe’s Golden Cross Signals Bullish Surge as Whales Stack Bags

Meme coin Pepe (PEPE) flashes a golden cross—the 50-day MA just pierced the 200-day. Historically, this technical pattern precedes rallies. Now, smart money’s buying the dip.
Whales aren’t waiting for the Fed to pivot. They’re front-running retail—again. Meanwhile, degens FOMO into leveraged longs like it’s 2021.
Will this time be different? Unlikely. But hey, at least the chart looks pretty.
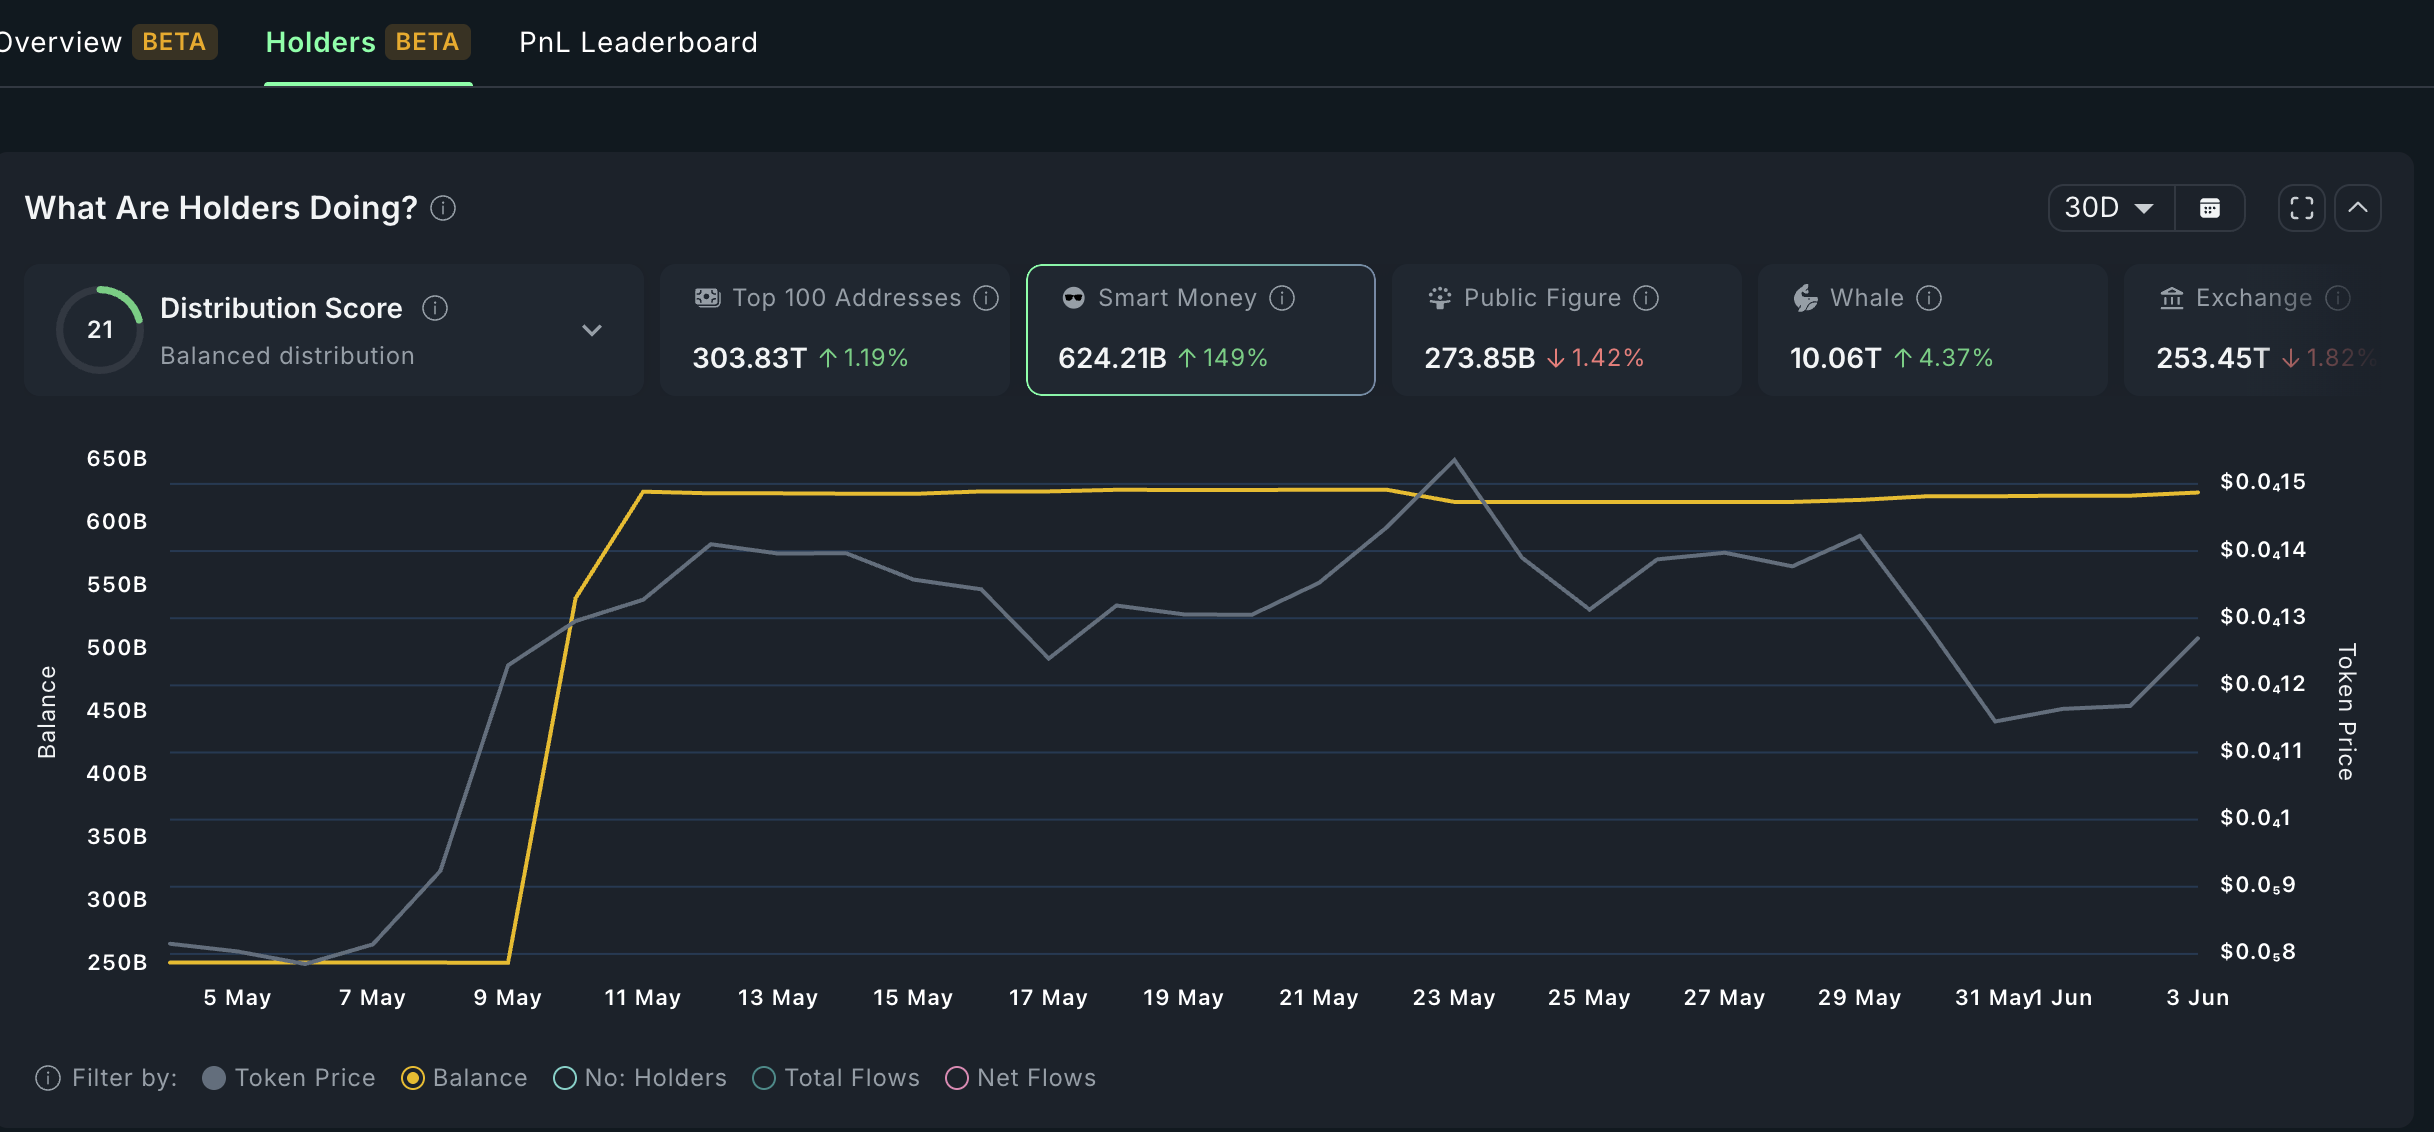 Pepe smart money buying | Source: Nansen
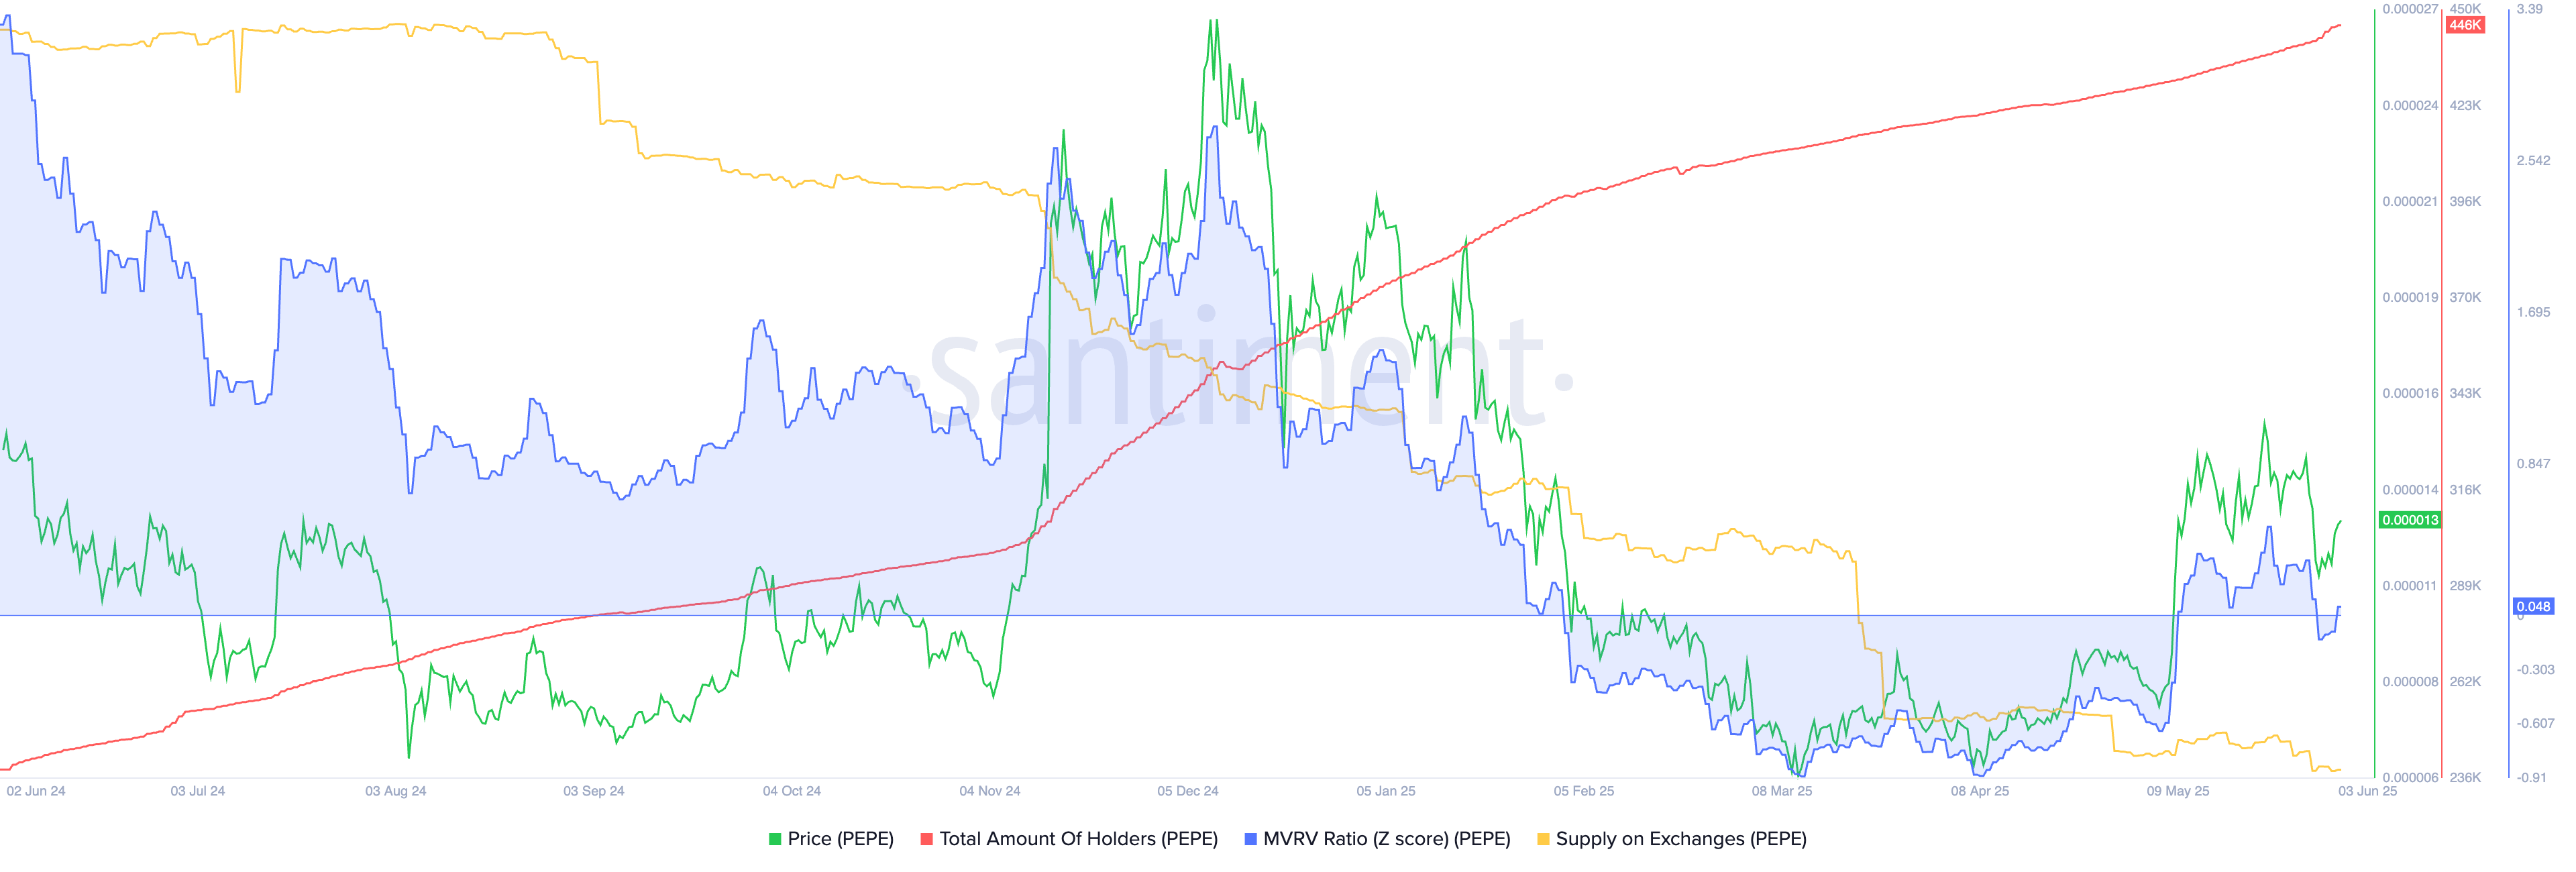
Additional data shows that the supply of PEPE coins on exchanges has been in a steady decline. It dropped to 104.85 trillion, down from 160 trillion at the start of the year. Falling supply suggests that investors are holding rather than selling.
Pepe price technical analysis
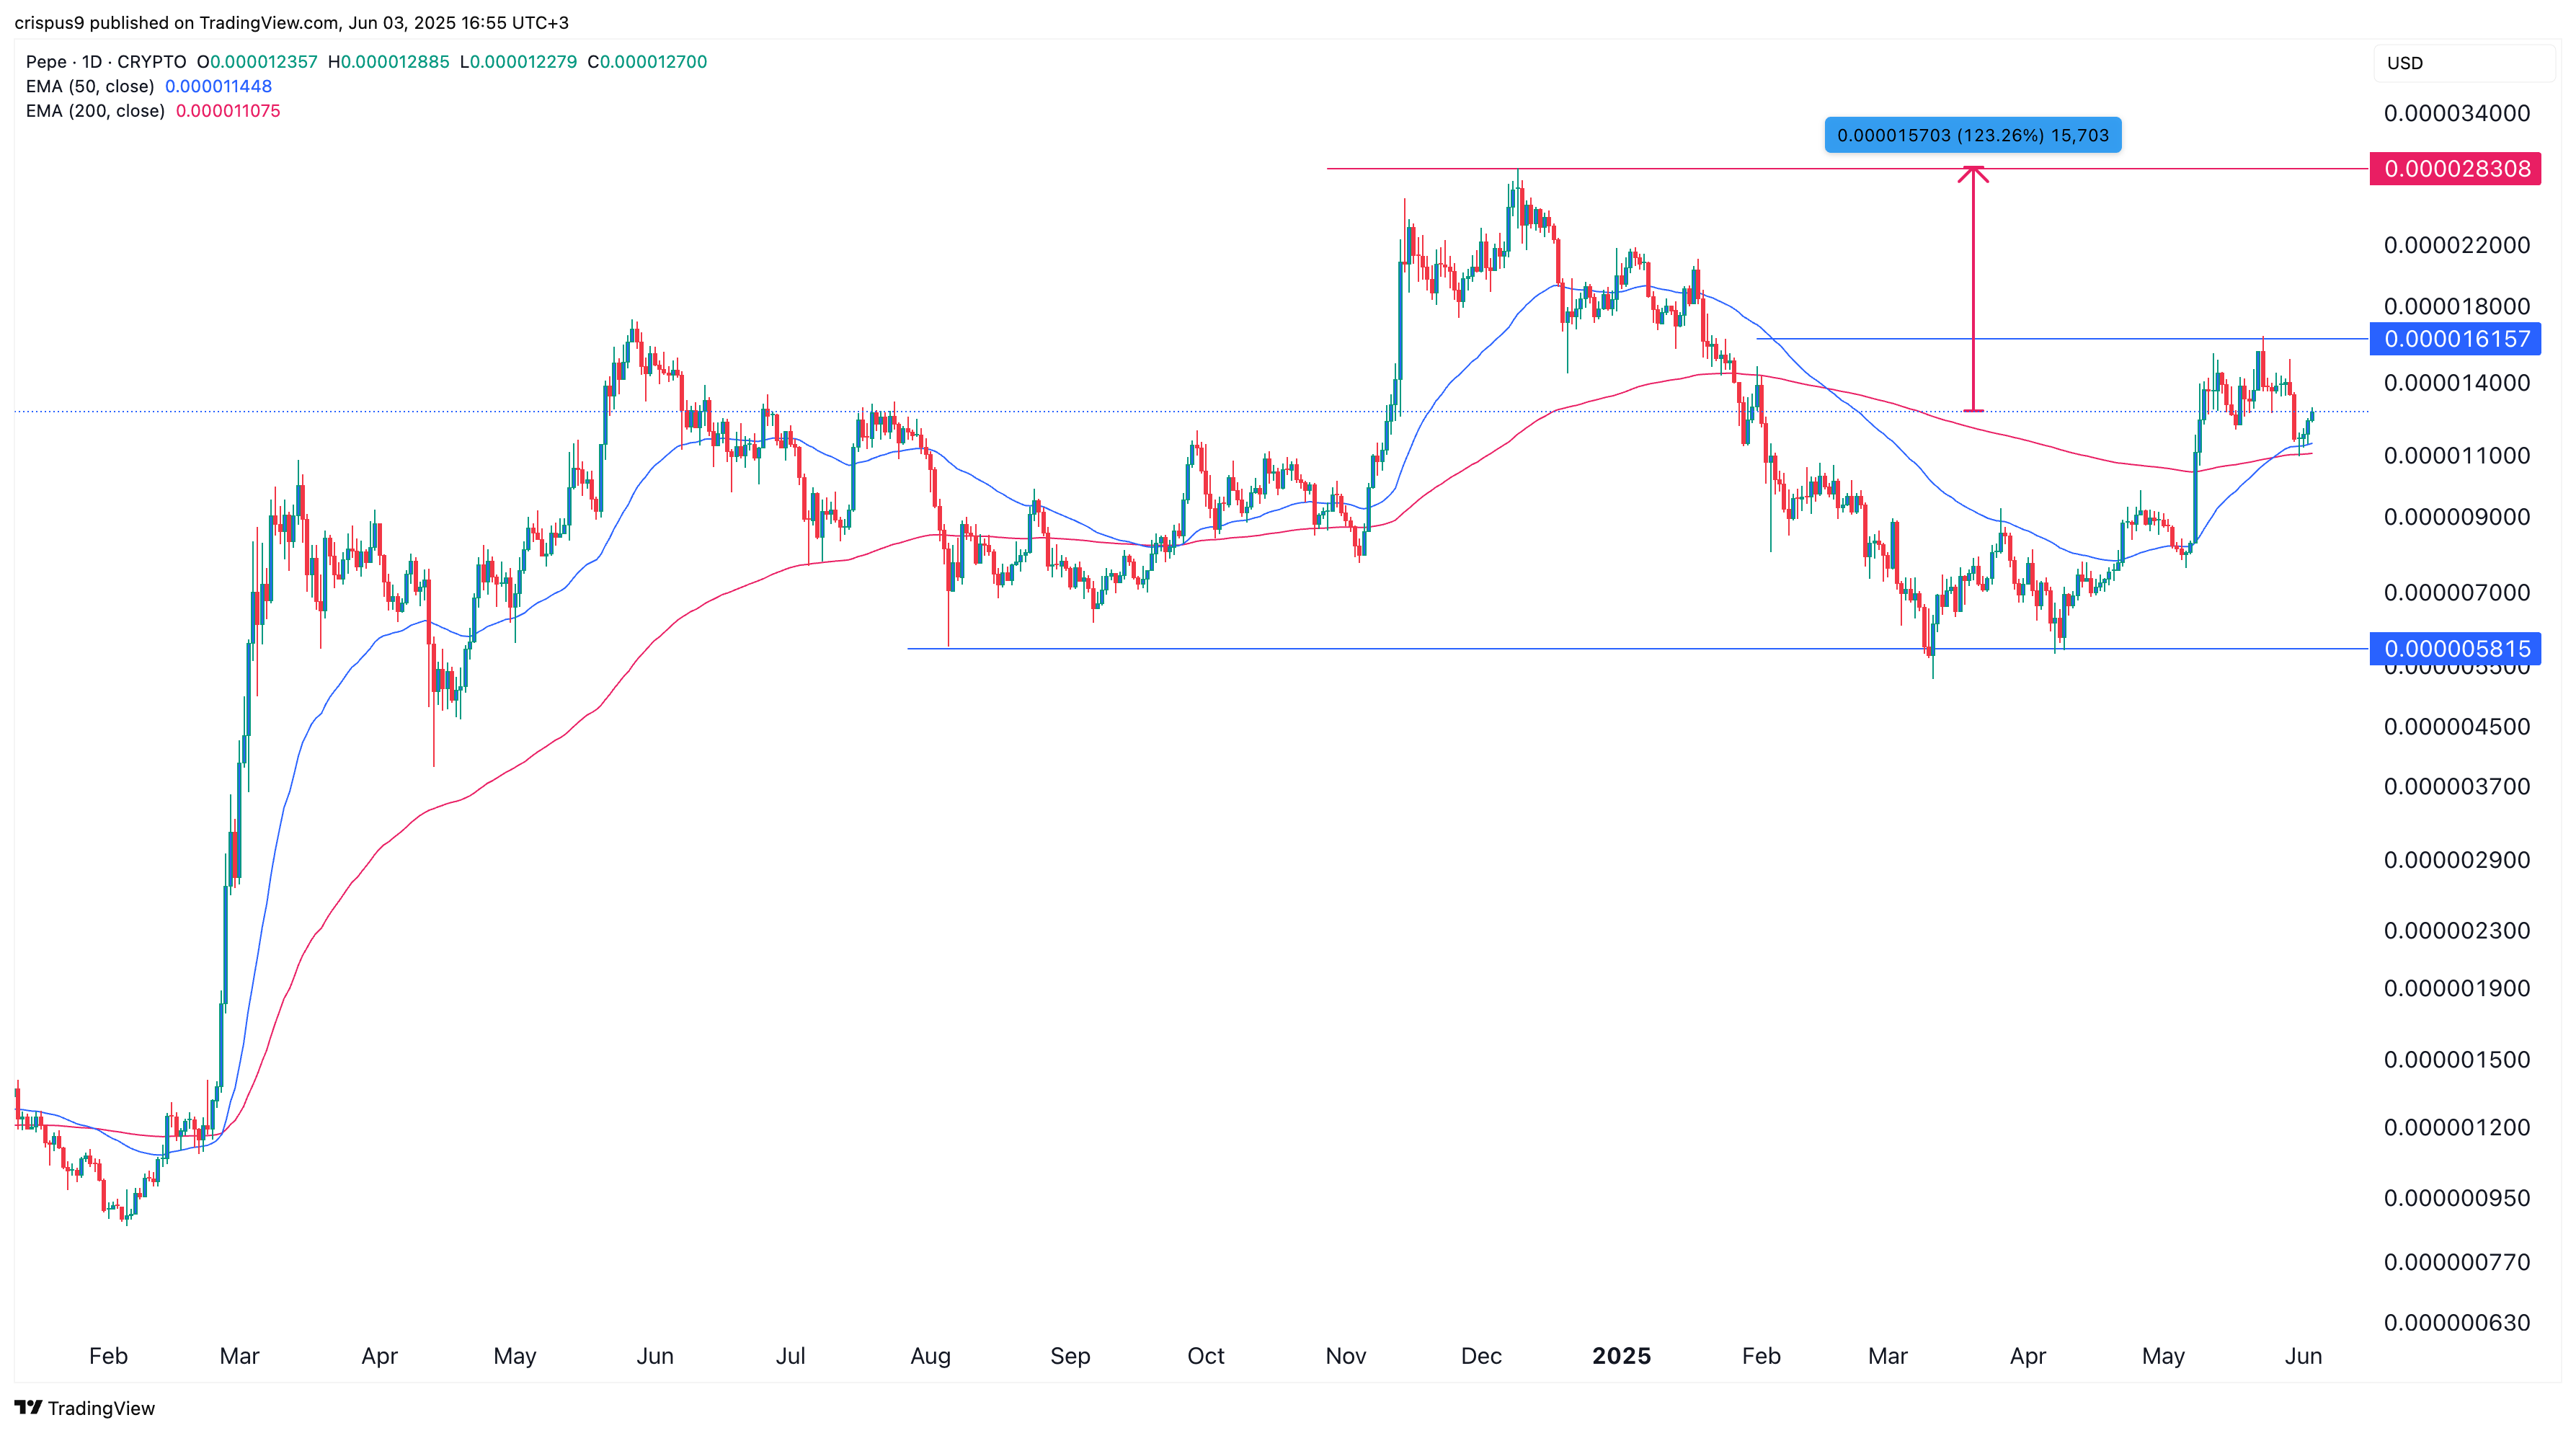
The daily chart shows that Pepe has rebounded from a low of $0.000005815 in April to $0.00001260. It has formed a golden cross pattern, with the 50-day and 200-day moving averages crossing, a technical setup that often signals long-term bullish potential.
Therefore, further gains will be confirmed if the price breaks above the key resistance level at $0.00001615, the May high. If that occurs, the next level to watch is $0.00002830, representing a 123% increase from the current price. A drop below the support at $0.000010 WOULD invalidate the bullish outlook.
