Cardano Hits Transaction Milestone—So Why’s the Price Teetering on a Cliff?

Cardano’s network just racked up another big round number in transactions—the kind of milestone that usually gets crypto bulls frothing. But the price action? Crickets. Or worse.
Here’s the irony: while the chain’s chugging along processing deals, ADA’s chart looks like it’s rehearsing for a swan dive. Classic crypto—build the tech, forget the tokenomics.
Meanwhile, TradFi bros are probably sipping lattes and muttering ’told you so’ into their spreadsheets. The lesson? Even in decentralized finance, gravity—and leverage—always wins.
Cardano price technical analysis points to a deeper dive
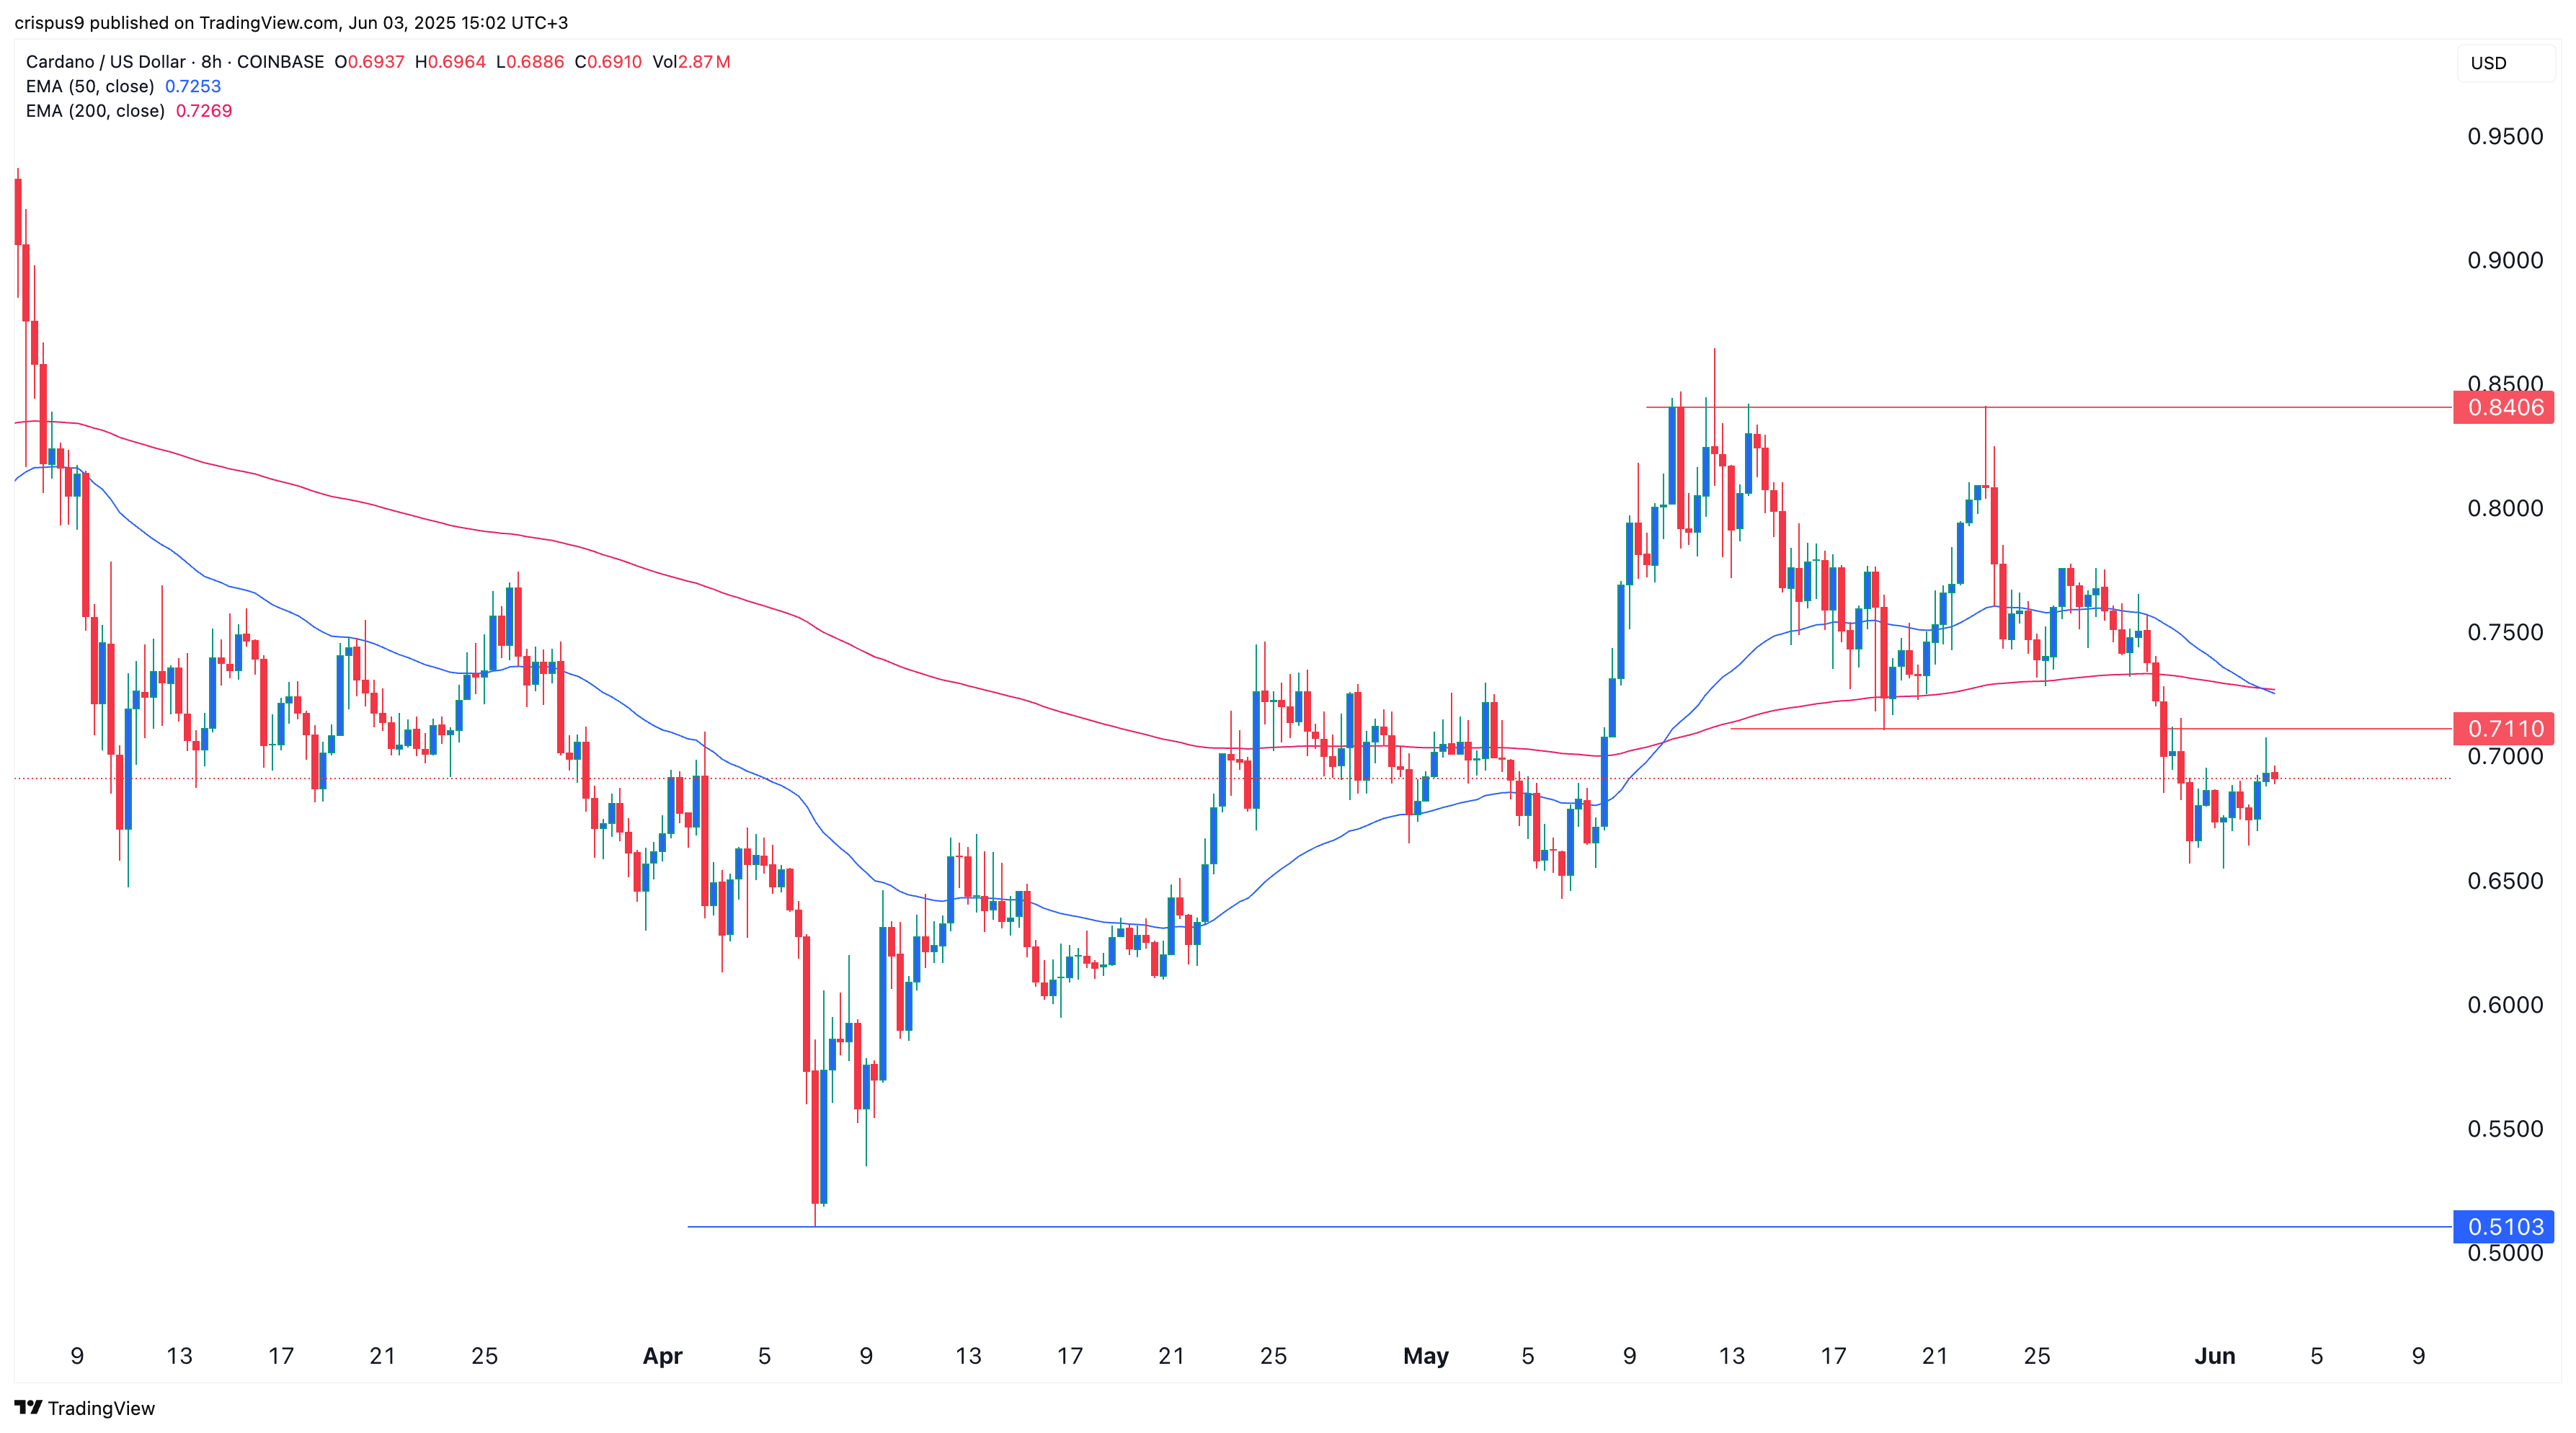
The daily chart shows that the ADA price has dropped significantly in the past few weeks. This decline followed the formation of a double-top pattern at $0.8405. It has since fallen below the neckline at $0.7110, its lowest level on May 19.
The coin has also formed a death cross pattern as the 50-day and 200-day moving averages have crossed each other, typically a strong bearish signal.
Cardano has also formed a bearish flag chart pattern, consisting of a vertical line and a rectangle. Therefore, the coin will likely break lower, potentially retesting the key support at $0.5100, its lowest point in April.
