Ethereum Bulls Charge Toward $3K as Chart Patterns Scream Buy

Ethereum’s price action is painting a textbook bullish setup—traders are betting the breakout could propel ETH past the psychological $3,000 barrier. Technical analysts point to ascending triangles and reclaimed moving averages, while leverage traders pile in (because what could go wrong?).
The smart money’s watching for a confirmed close above $2,900—a move that would trap bears and likely trigger algorithmic buying sprees. Of course, Wall Street’s still busy ’discovering’ crypto fundamentals—just in time for the next 20% correction.
ETH price analysis
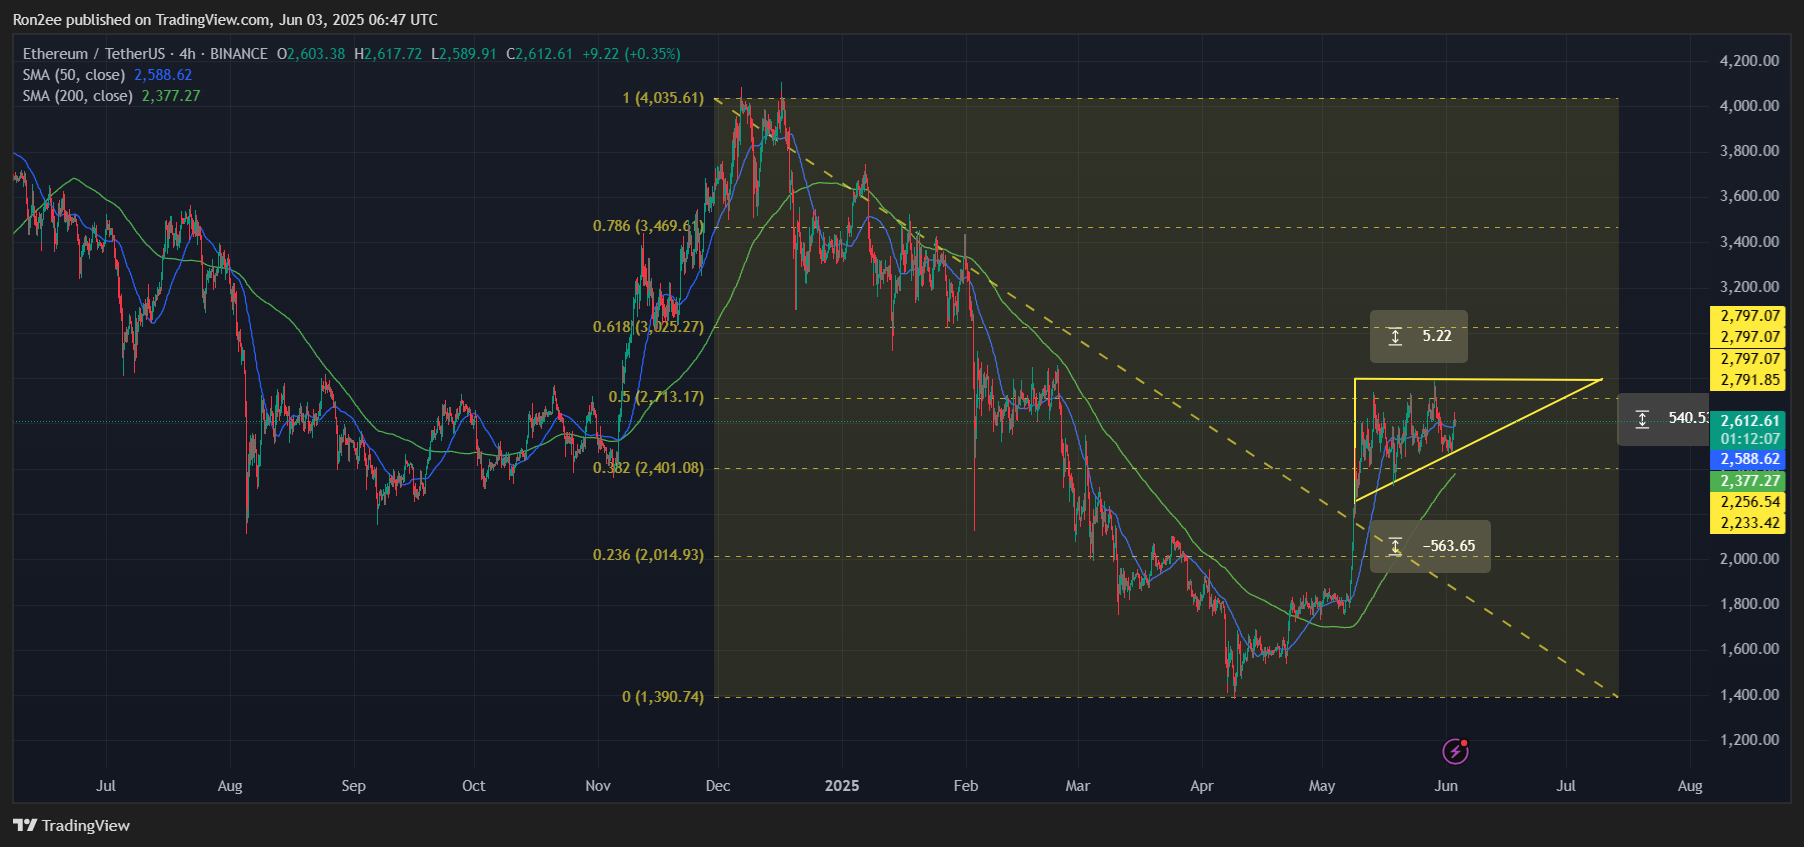
On the 4-hour ETH/USDT chart, ETH price remains above the rising trendline of a multi-week ascending triangle and is holding firm above the 50-period Simple Moving Average, a sign of sustained bullish momentum.
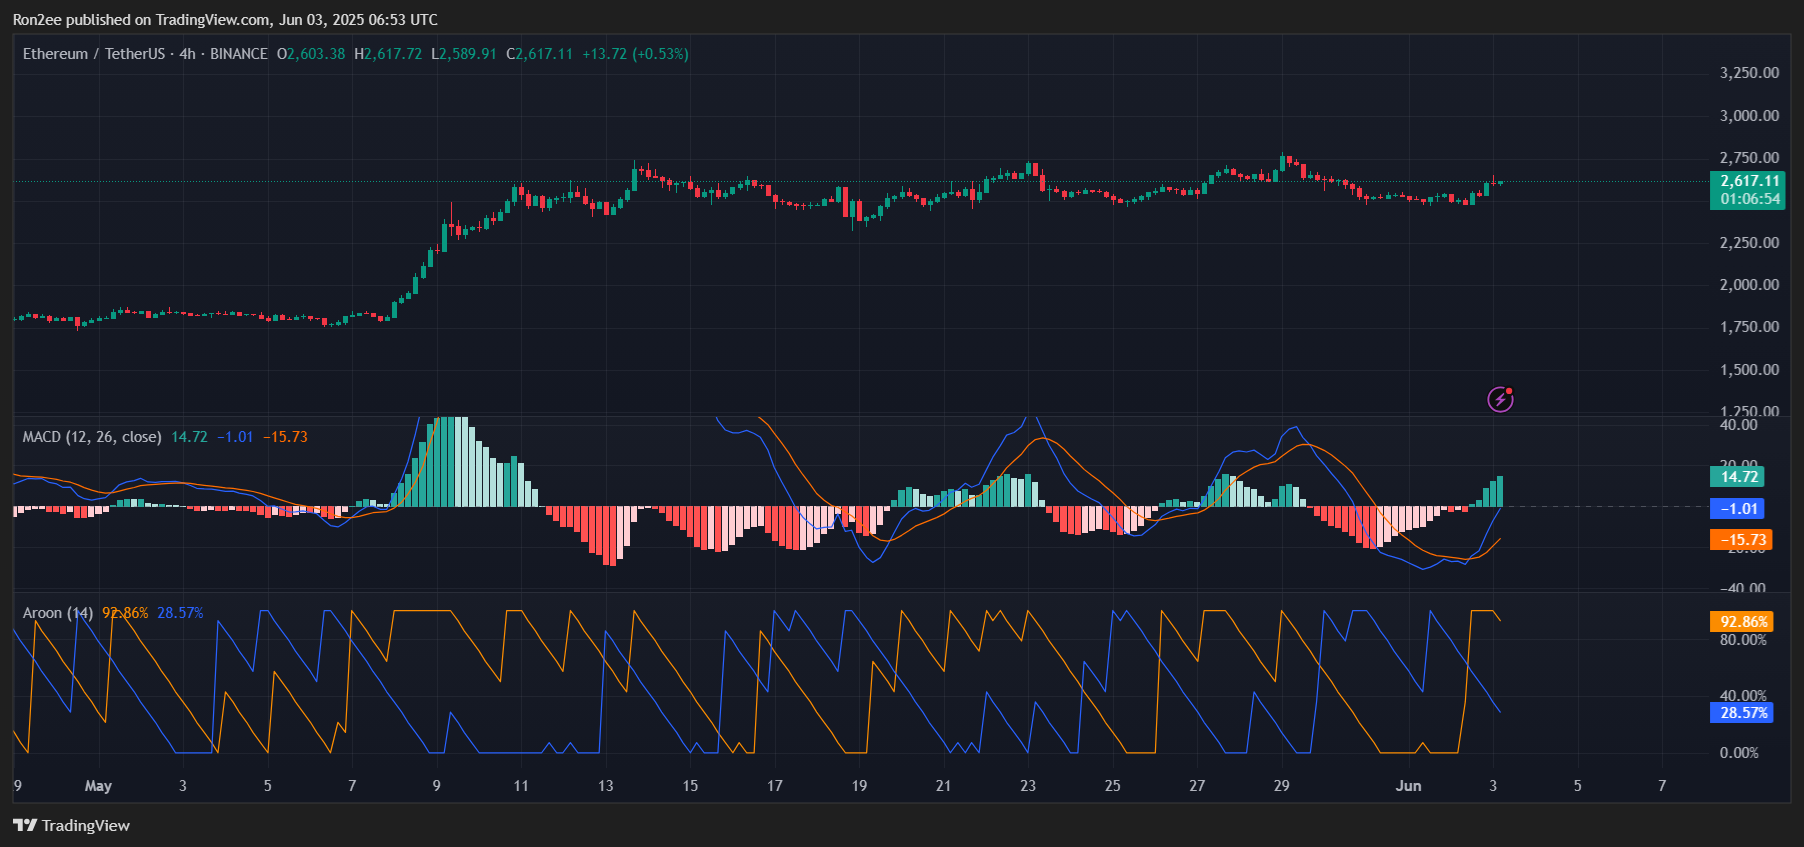
The Aroon Up indicator is currently at 92.87%, while the Aroon Down is at 28.57%, showing that the uptrend is clearly dominating. To top it off, the MACD has made a bullish crossover, further confirming upward pressure.
If this momentum continues, ETH could first test the $2,713 level, which lines up with the 50% Fibonacci retracement zone. A breakout above that could pave the way toward $3,000, Ethereum’s 61.8% retracement level, which WOULD mark a roughly 15% jump from its current price.
On the flip side, if ETH dips below $2,500, it might invalidate the current bullish setup. In that case, we could see a pullback toward the $2,377 level, which coincides with the 200-day SMA and may act as a key support zone.
