Bitcoin’s Bull Run: Still Charging or Out of Steam? A Technical Reality Check

Bitcoin’s price action has traders split—is this a pause before the next leg up, or the start of a brutal comedown? We break down the charts without the hopium.
Key levels to watch: The $70K psychological barrier isn’t just round-number bias—it’s where institutional order books get interesting. Meanwhile, derivatives traders keep levering up like it’s 2021 all over again.
The macro wildcard: Fed rate cuts might pump crypto... unless traditional finance finally admits they’re just gambling with extra steps. Technicals suggest consolidation, but since when did crypto respect textbook patterns?
Bottom line: This market moves faster than a degen spotting a ’low-cap gem.’ Whether you’re stacking sats or waiting for the crash, one thing’s certain—volatility isn’t going anywhere.
Key technical points
- Channel Low Support at $104,300: Acts as the structural base for the current bullish trend; holding this level is crucial for any continuation to the upside.
- 200-Day Moving Average: Bitcoin is currently trading above this dynamic support, reinforcing bullish bias if it continues to hold.
- Trendline Resistance Above: A descending trendline acts as minor resistance. Breaking this would signify a structural shift and the start of a new bullish leg.
- Bullish Market Structure Since $74,000: Price continues to print higher highs and higher lows. As long as this pattern holds, the trend remains intact.
- “Power of Three” Accumulation Structure: Price appears to be forming an accumulation-manipulation-distribution phase. Reclaiming the channel confirms the bullish reversal.
- Failed Auction Possibility: If price reclaims the channel after manipulation, a failed auction scenario is confirmed, greatly increasing the odds of a move to $116,000.
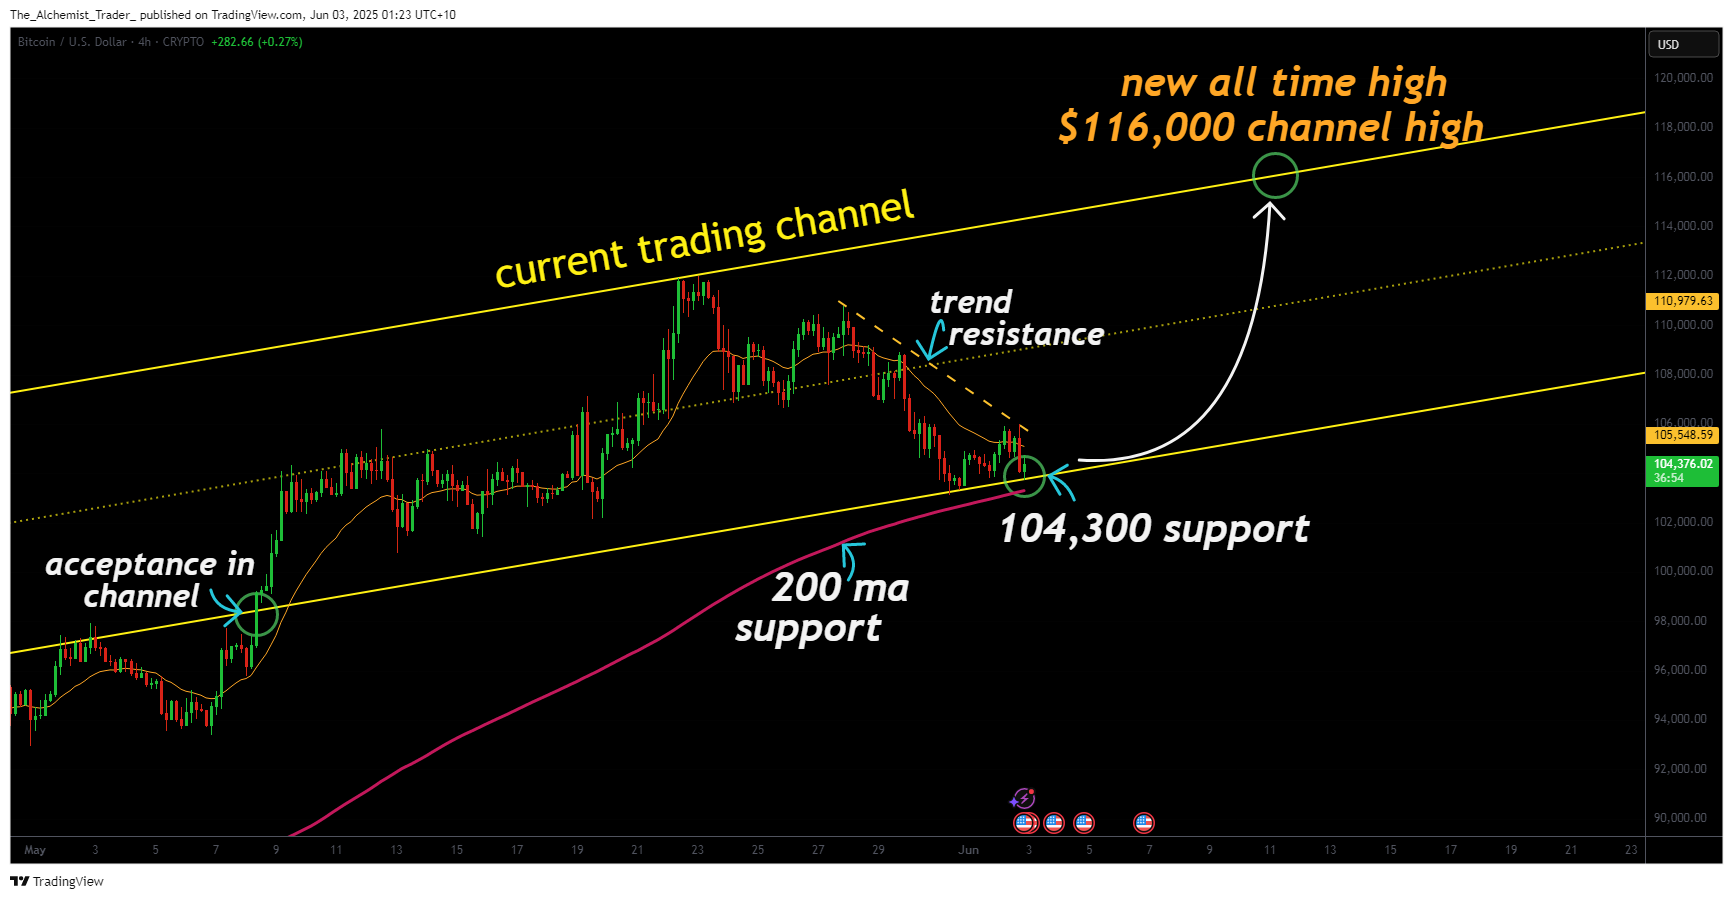
From a market context perspective, the rejection from the channel high and subsequent retracement toward the channel low are technically expected. Price inside a well-defined channel often oscillates between its boundaries before breaking in the dominant direction. The rejection at $111,900 aligned with the channel’s resistance, while the current stalling at $104,300 has already produced a strong bullish candle, signaling that buyers are defending this level.
This type of impulsive bounce from support suggests a short-term sentiment shift. Structurally, bitcoin is trading back within its established bullish channel, implying the previous breakout may have been an early expansion or overextension. The current retest can be seen as a healthy reset before continuation.
Of particular importance is the 200-day moving average now sitting just below the price. Historically, this level has acted as long-term support during major bull trends. A close and consolidation above it typically signals that the broader uptrend remains in place. As long as BTC holds this level, it projects long-term strength.
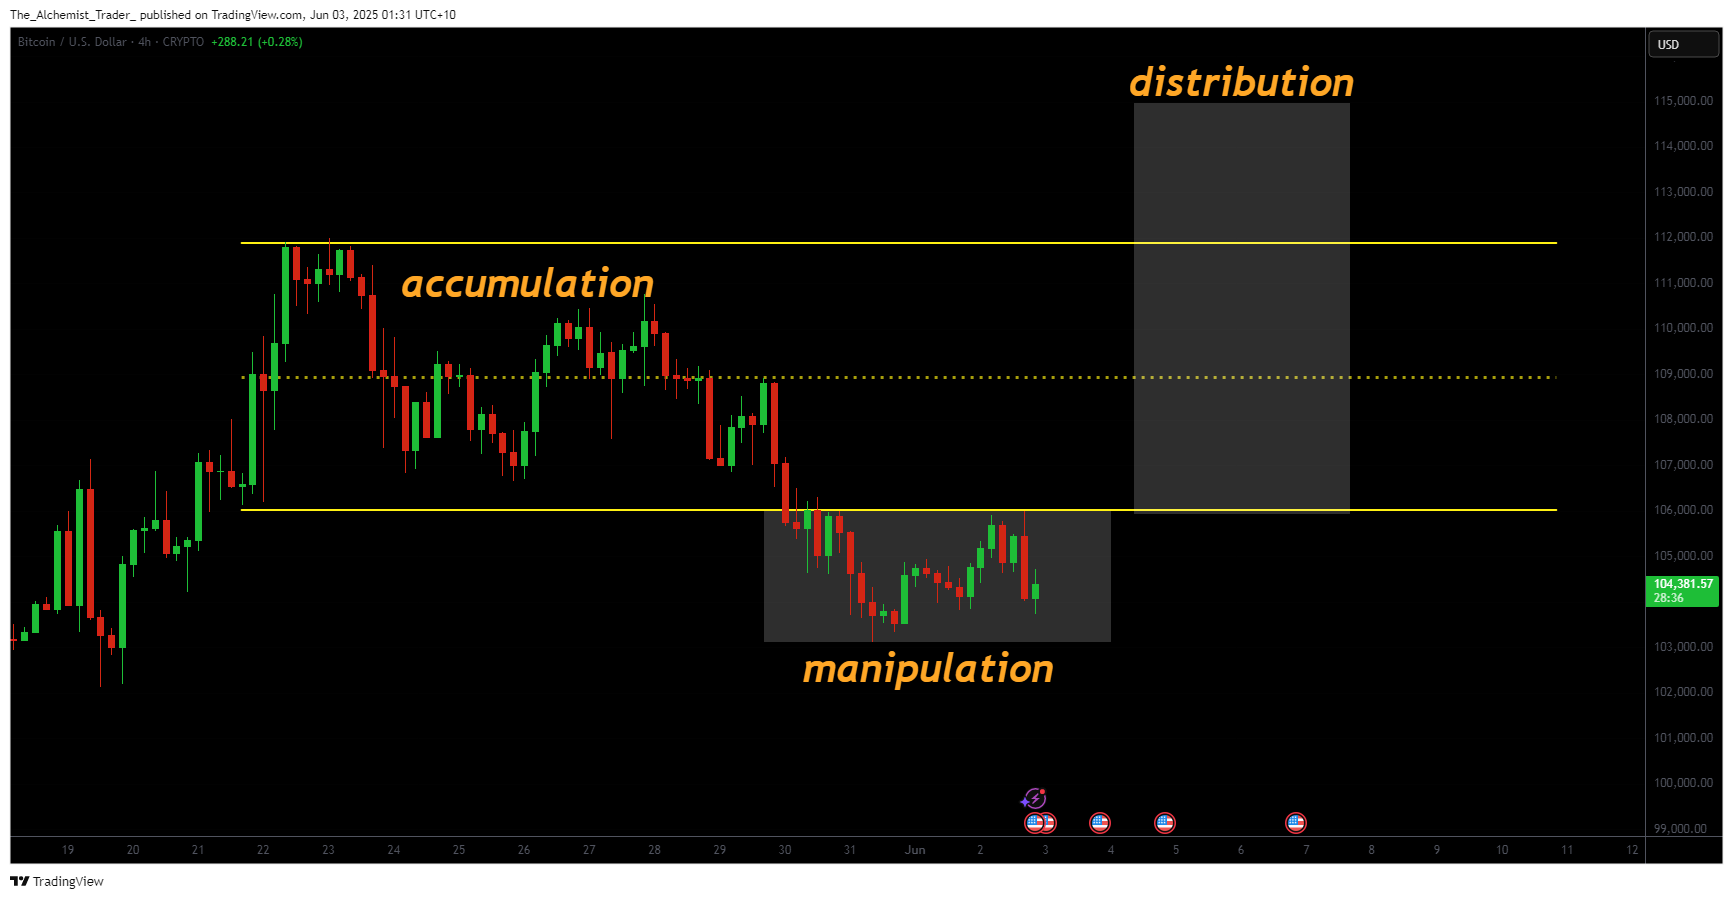
Beyond surface-level technicals, there is growing interest in a possible “Power of Three” pattern. This accumulation framework includes three phases:
In this context, the drop below the channel low may represent manipulation. A reclaim of the channel WOULD confirm a failed auction, a classic deviation followed by strong continuation. If this pattern holds, the move to $116,000 could unfold rapidly, aligning with Fibonacci extensions and the measured move from the channel range.
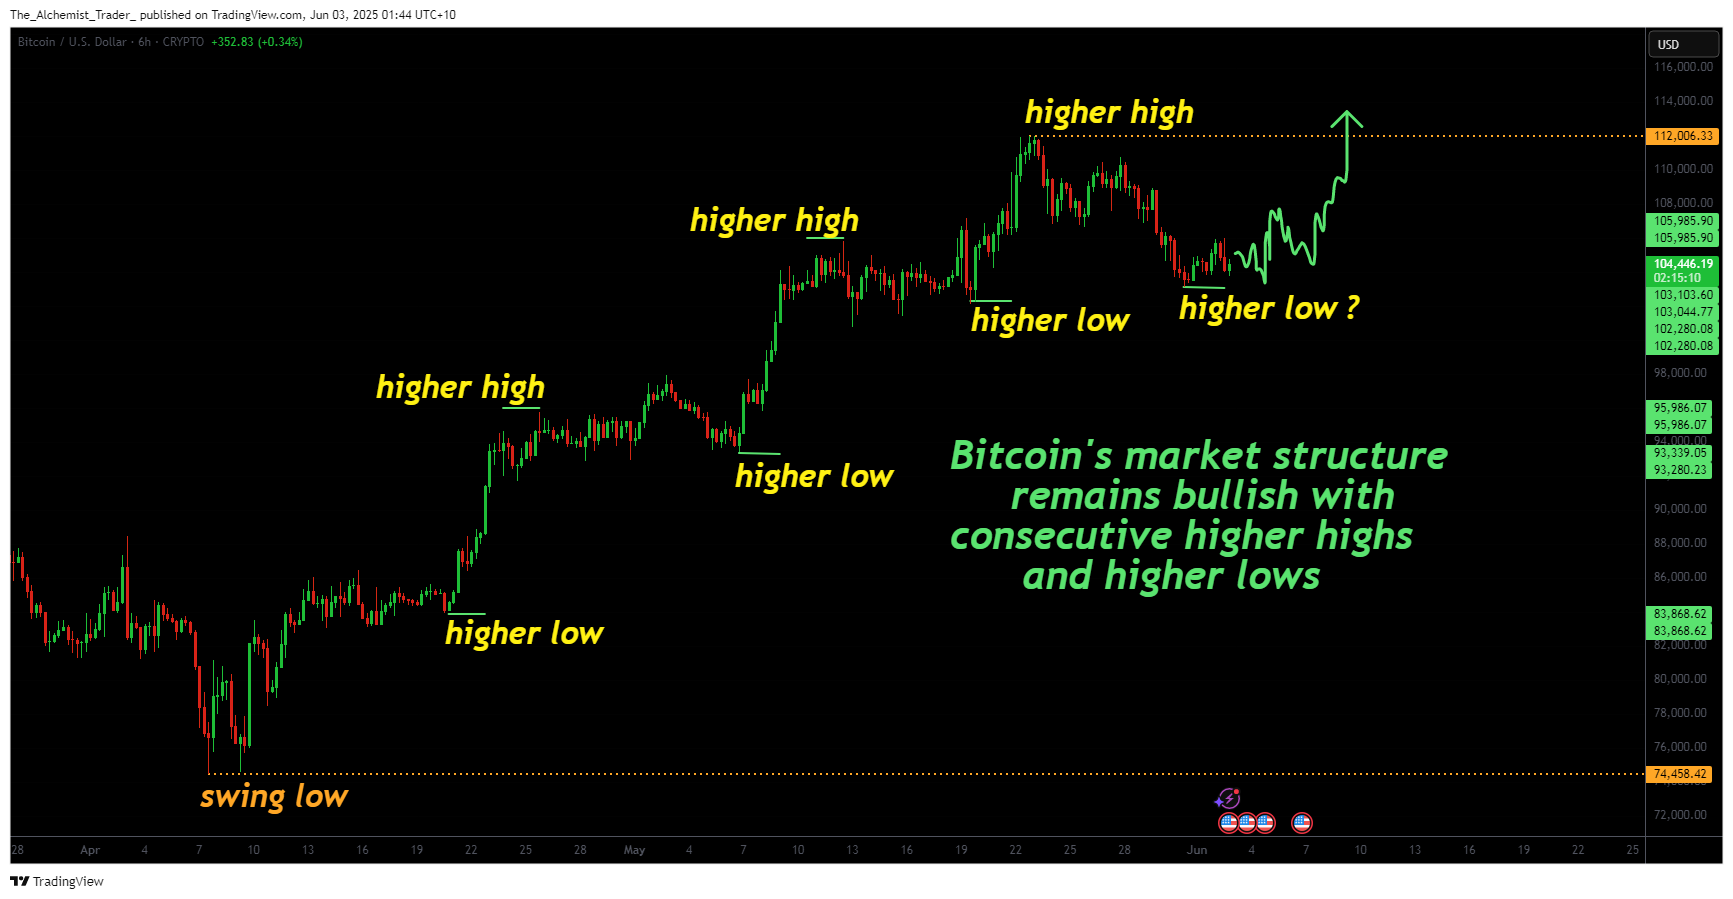
Bitcoin’s broader structure remains technically bullish. Since forming a major swing low at $74,000, the asset has consistently printed higher highs and higher lows. The current correction fits within that structure and could represent a new higher low. Only a clean break below $104,300 on high volume would challenge this thesis.
Volume remains telling. While it spiked during the drop, it has stayed elevated during the defense of $104,300, evidence that demand is present at support. Sustained buying pressure at this level could set the stage for the next upward rotation.
What to expect in the coming price action
As long as Bitcoin holds above $104,300 and remains above the 200-day moving average, the bullish market structure is intact. A reclaim of the channel followed by a break of trendline resistance would confirm the next bullish phase. Expect a rotation toward $111,900, followed by a measured extension toward $116,000. If this plays out, Bitcoin would validate the Power of Three structure and confirm that the recent breakdown was a deviation, fueling a failed auction rally toward new highs.
