VIRTUAL Eyes $3.3 Surge as Golden Cross Pattern Emerges—Time to Buy or Just Another Crypto Mirage?

Technical traders are buzzing as VIRTUAL flirts with a bullish golden cross—a signal that’s historically preceded major rallies. Could this propel the token to $3.3, or is it just another case of hopium overpowering fundamentals?
The setup? A potential golden cross, where the 50-day moving average overtakes the 200-day. Textbook stuff—if you ignore the fact that crypto markets treat technical analysis like a roulette wheel. Meanwhile, Wall Street ‘experts’ are already drafting their ‘I told you so’ tweets for when this either moons or crashes spectacularly.
One thing’s certain: in a market where ‘fundamentals’ often mean a meme and a dream, VIRTUAL’s next move will be anything but boring. Buckle up.
VIRTUAL price analysis
From a technical standpoint, VIRTUAL is flashing bullish signals. The token formed a bullish engulfing candle on Tuesday’s daily chart, confirming a U-shaped recovery that’s been forming since its April correction.
Crucially, VIRTUAL broke above the $2.22 resistance, which also served as the neckline of a cup-like pattern. It then went on to break above the upper boundary of an ascending triangle, a pattern that typically signals a potential upward breakout.
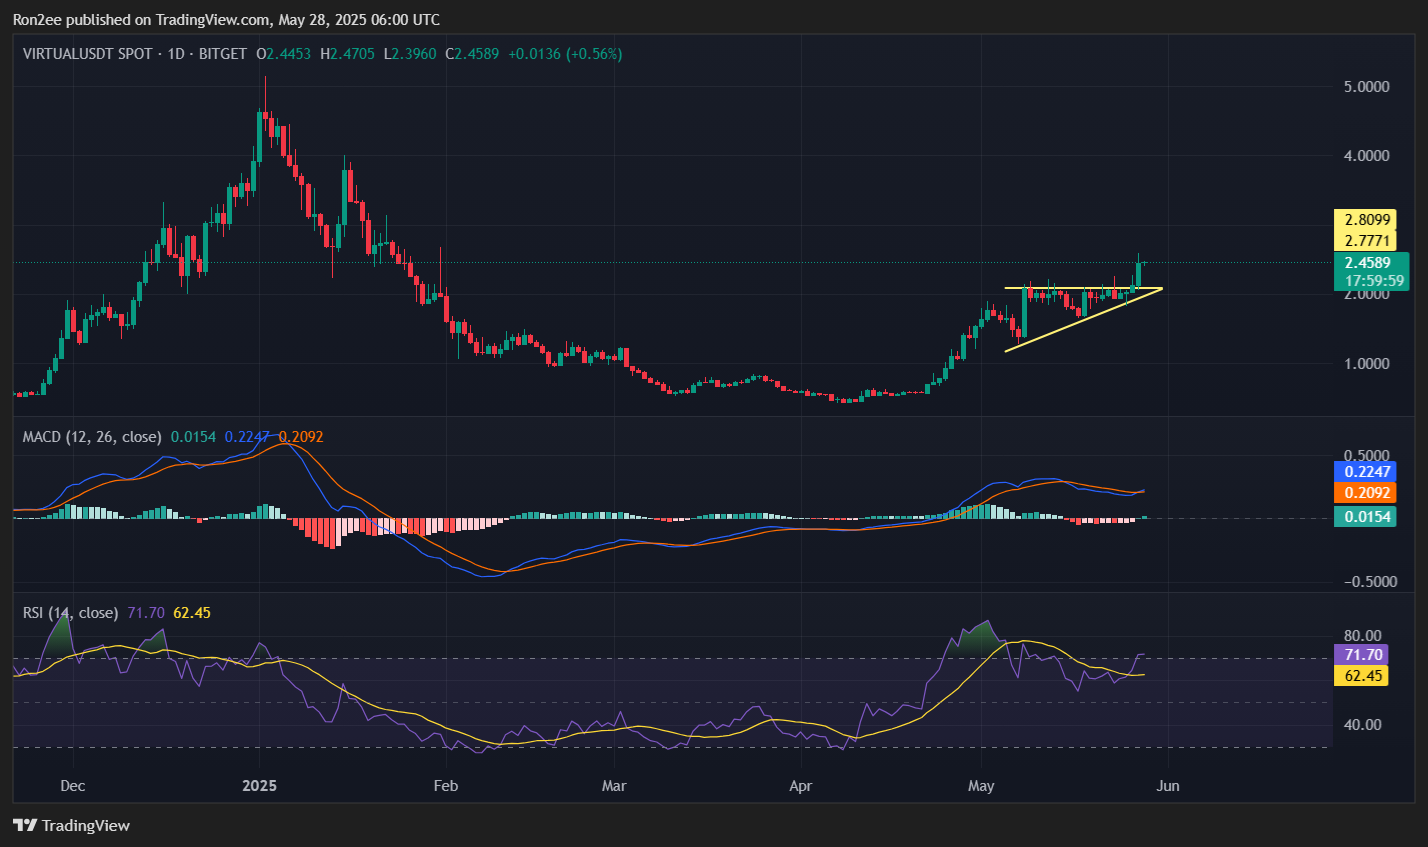
Momentum indicators support the bullish case with the MACD line having crossed above the signal line, indicating continued buying strength.
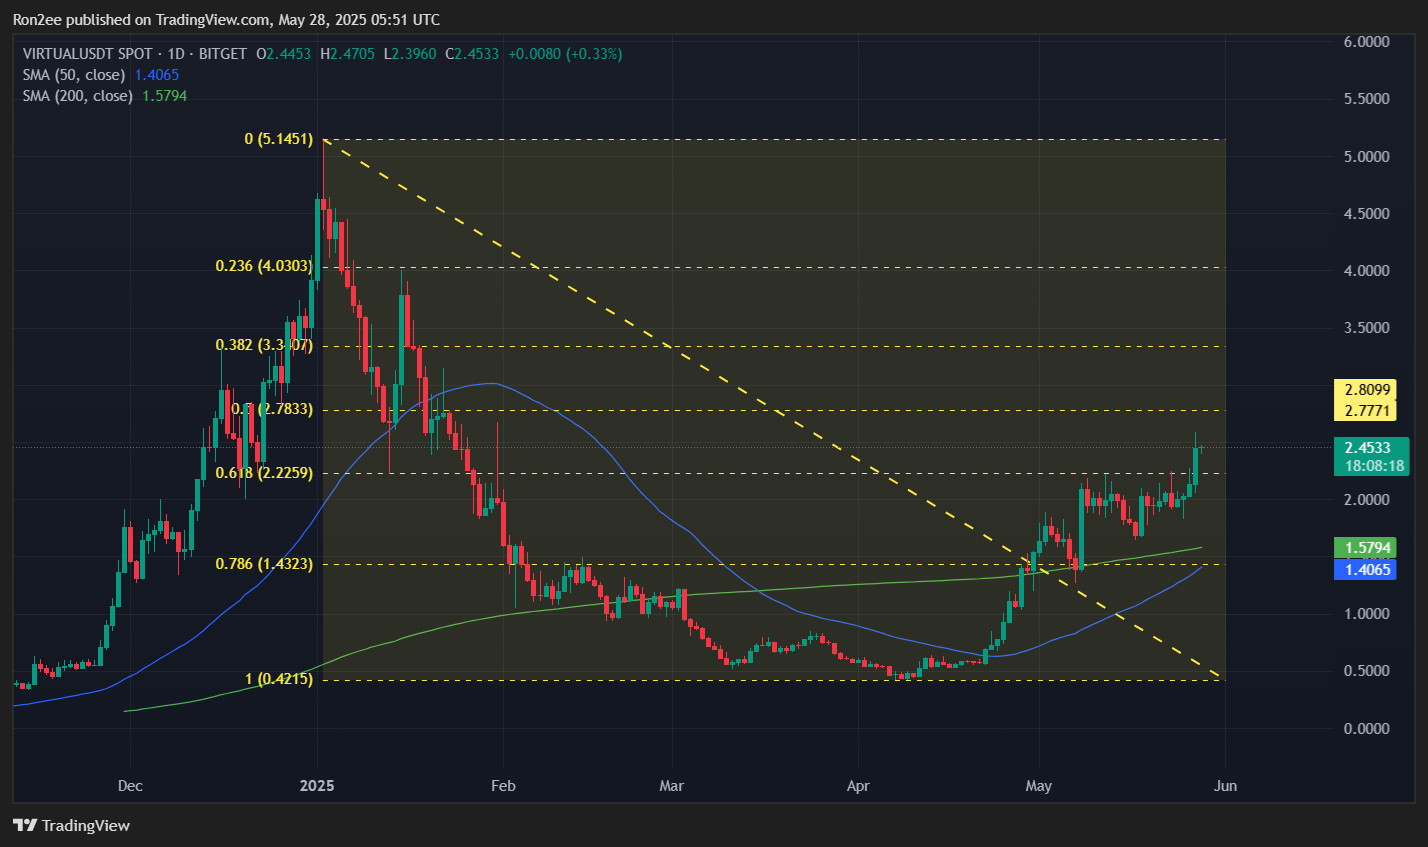
The price has also moved above both the 50-day and 200-day moving averages, which are now nearing a golden cross, a classic bullish signal, while the Relative Strength Index is trending upward, showing strong buying pressure.
If the bulls hold control, VIRTUAL could next target $2.78, a level aligned with the 50% Fibonacci retracement. A breakout above that WOULD open the door to $3.38, which aligns with the 0.382 Fibonacci level, roughly 38% higher than current prices.
However, if sellers push back from $2.78, the price could retest $2.22, which now acts as a key support and also lines up with the 78.6% Fibonacci retracement level.
Disclosure: This article does not represent investment advice. The content and materials featured on this page are for educational purposes only.

Log in to Reply
Log in to comment your thoughtsComments
Related Articles
|Square
Get the BTCC app to start your crypto journey
Get started today Scan to join our 100M+ users