Solana’s Rally to $200 Hits Speed Bump Despite Surging Network Activity

SOL’s moonshot stalls as traders face reality—even blockchain’s busiest highways get traffic jams.
Network metrics scream adoption: transactions spike, new addresses flood in. But price action? Stuck in first gear. Classic crypto—build the future, watch the charts ignore it.
Wall Street analysts would call this ’dislocation.’ We call it Tuesday.
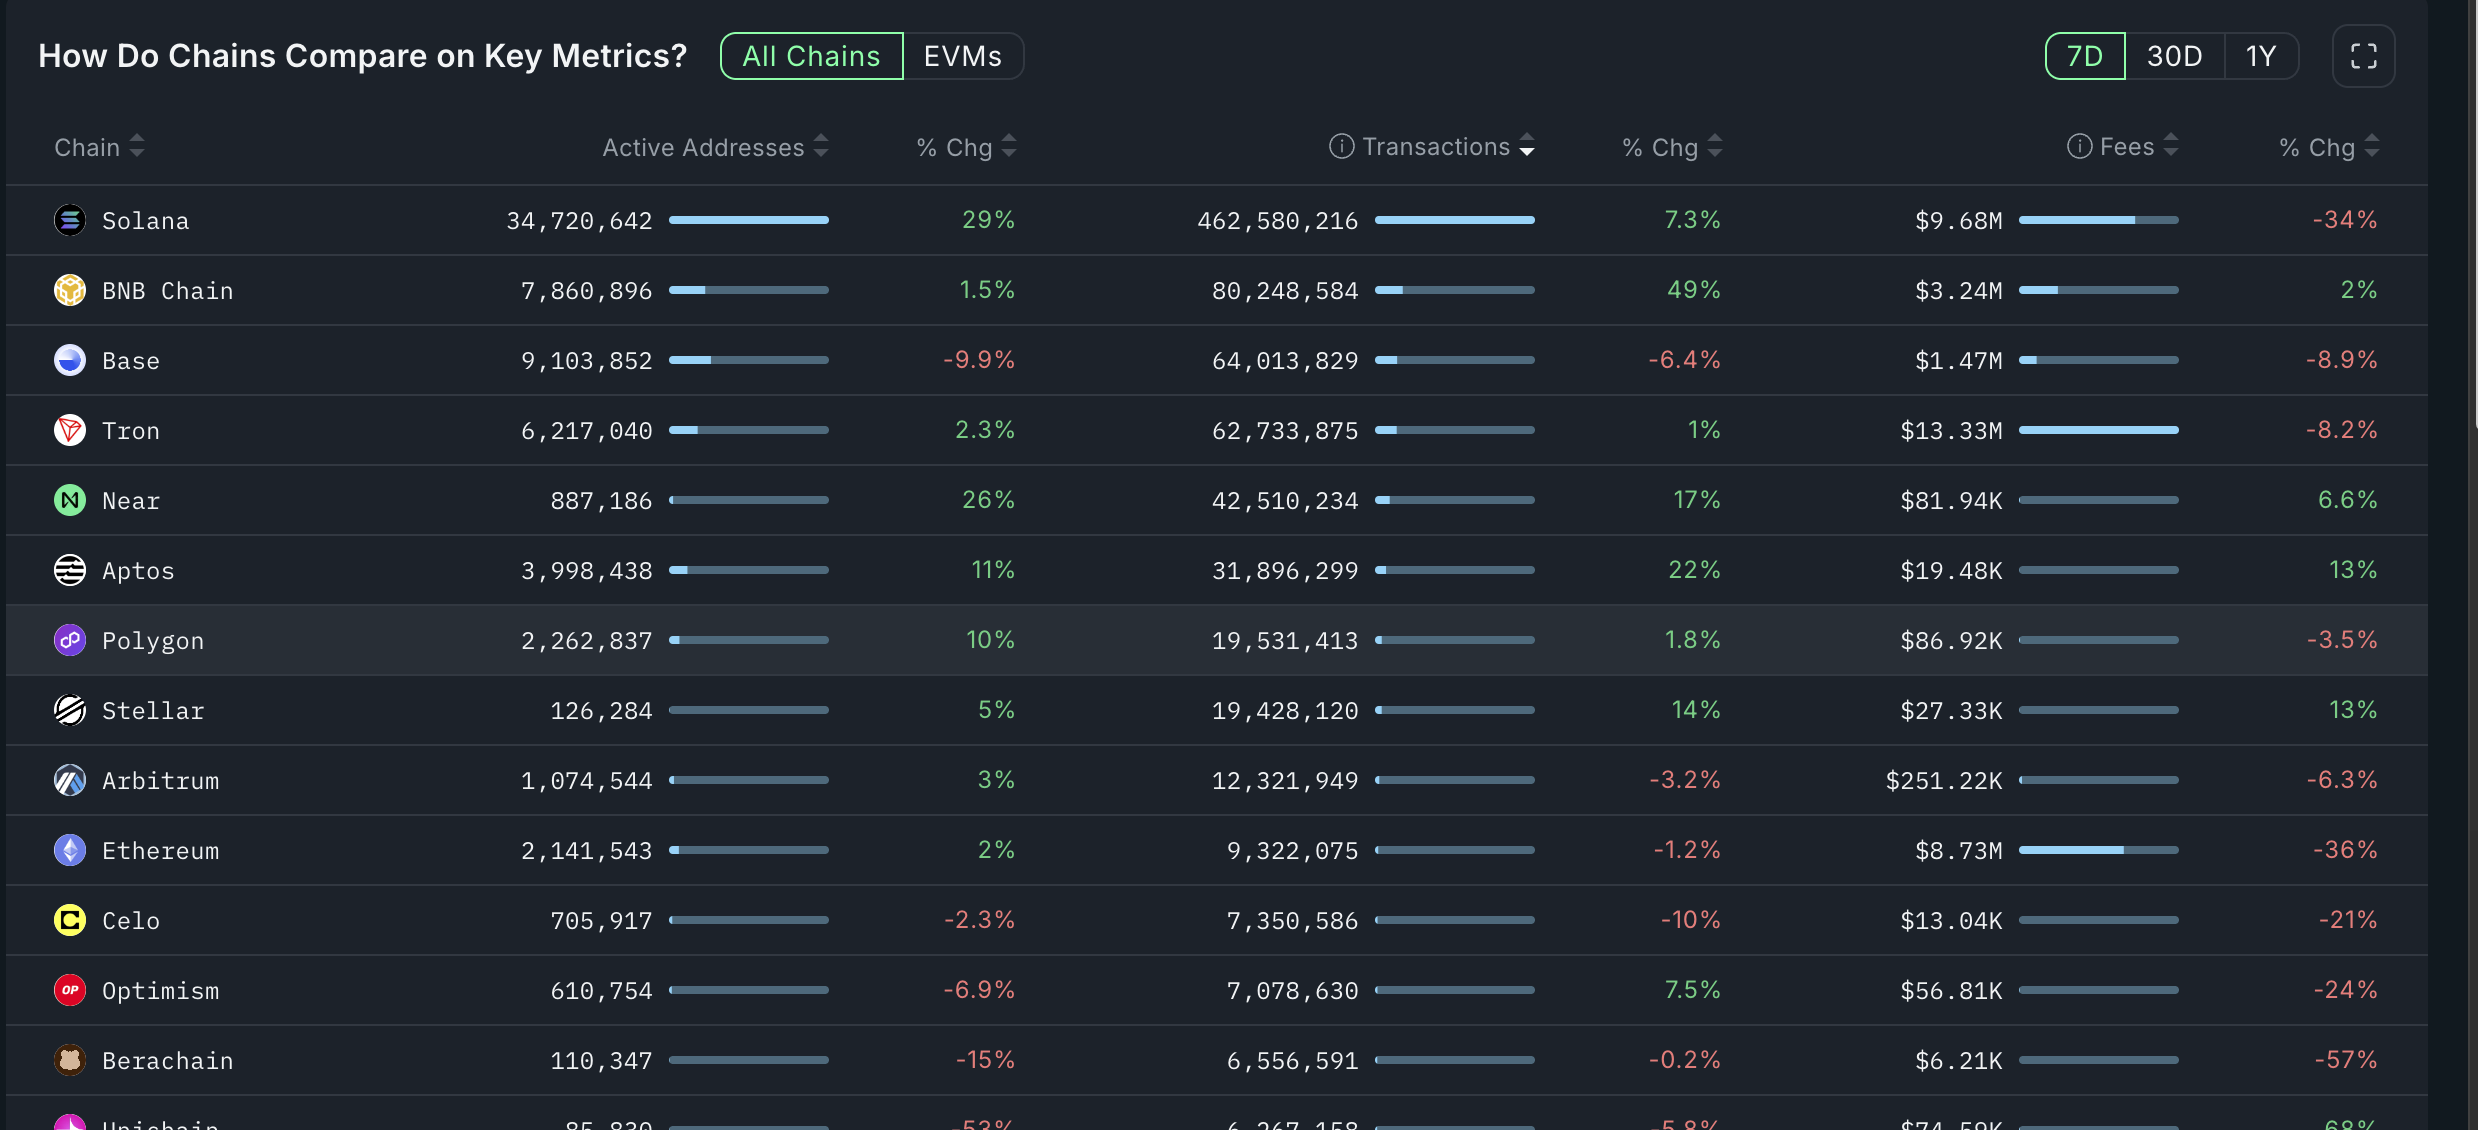 Solana leads all chains on active addresses and transactions | Source: Nansen
Solana is also a major player in the decentralized exchange industry, handling $22.7 billion worth of transactions in the last seven days and $97 billion in the last thirty days.
Solana price technical analysis
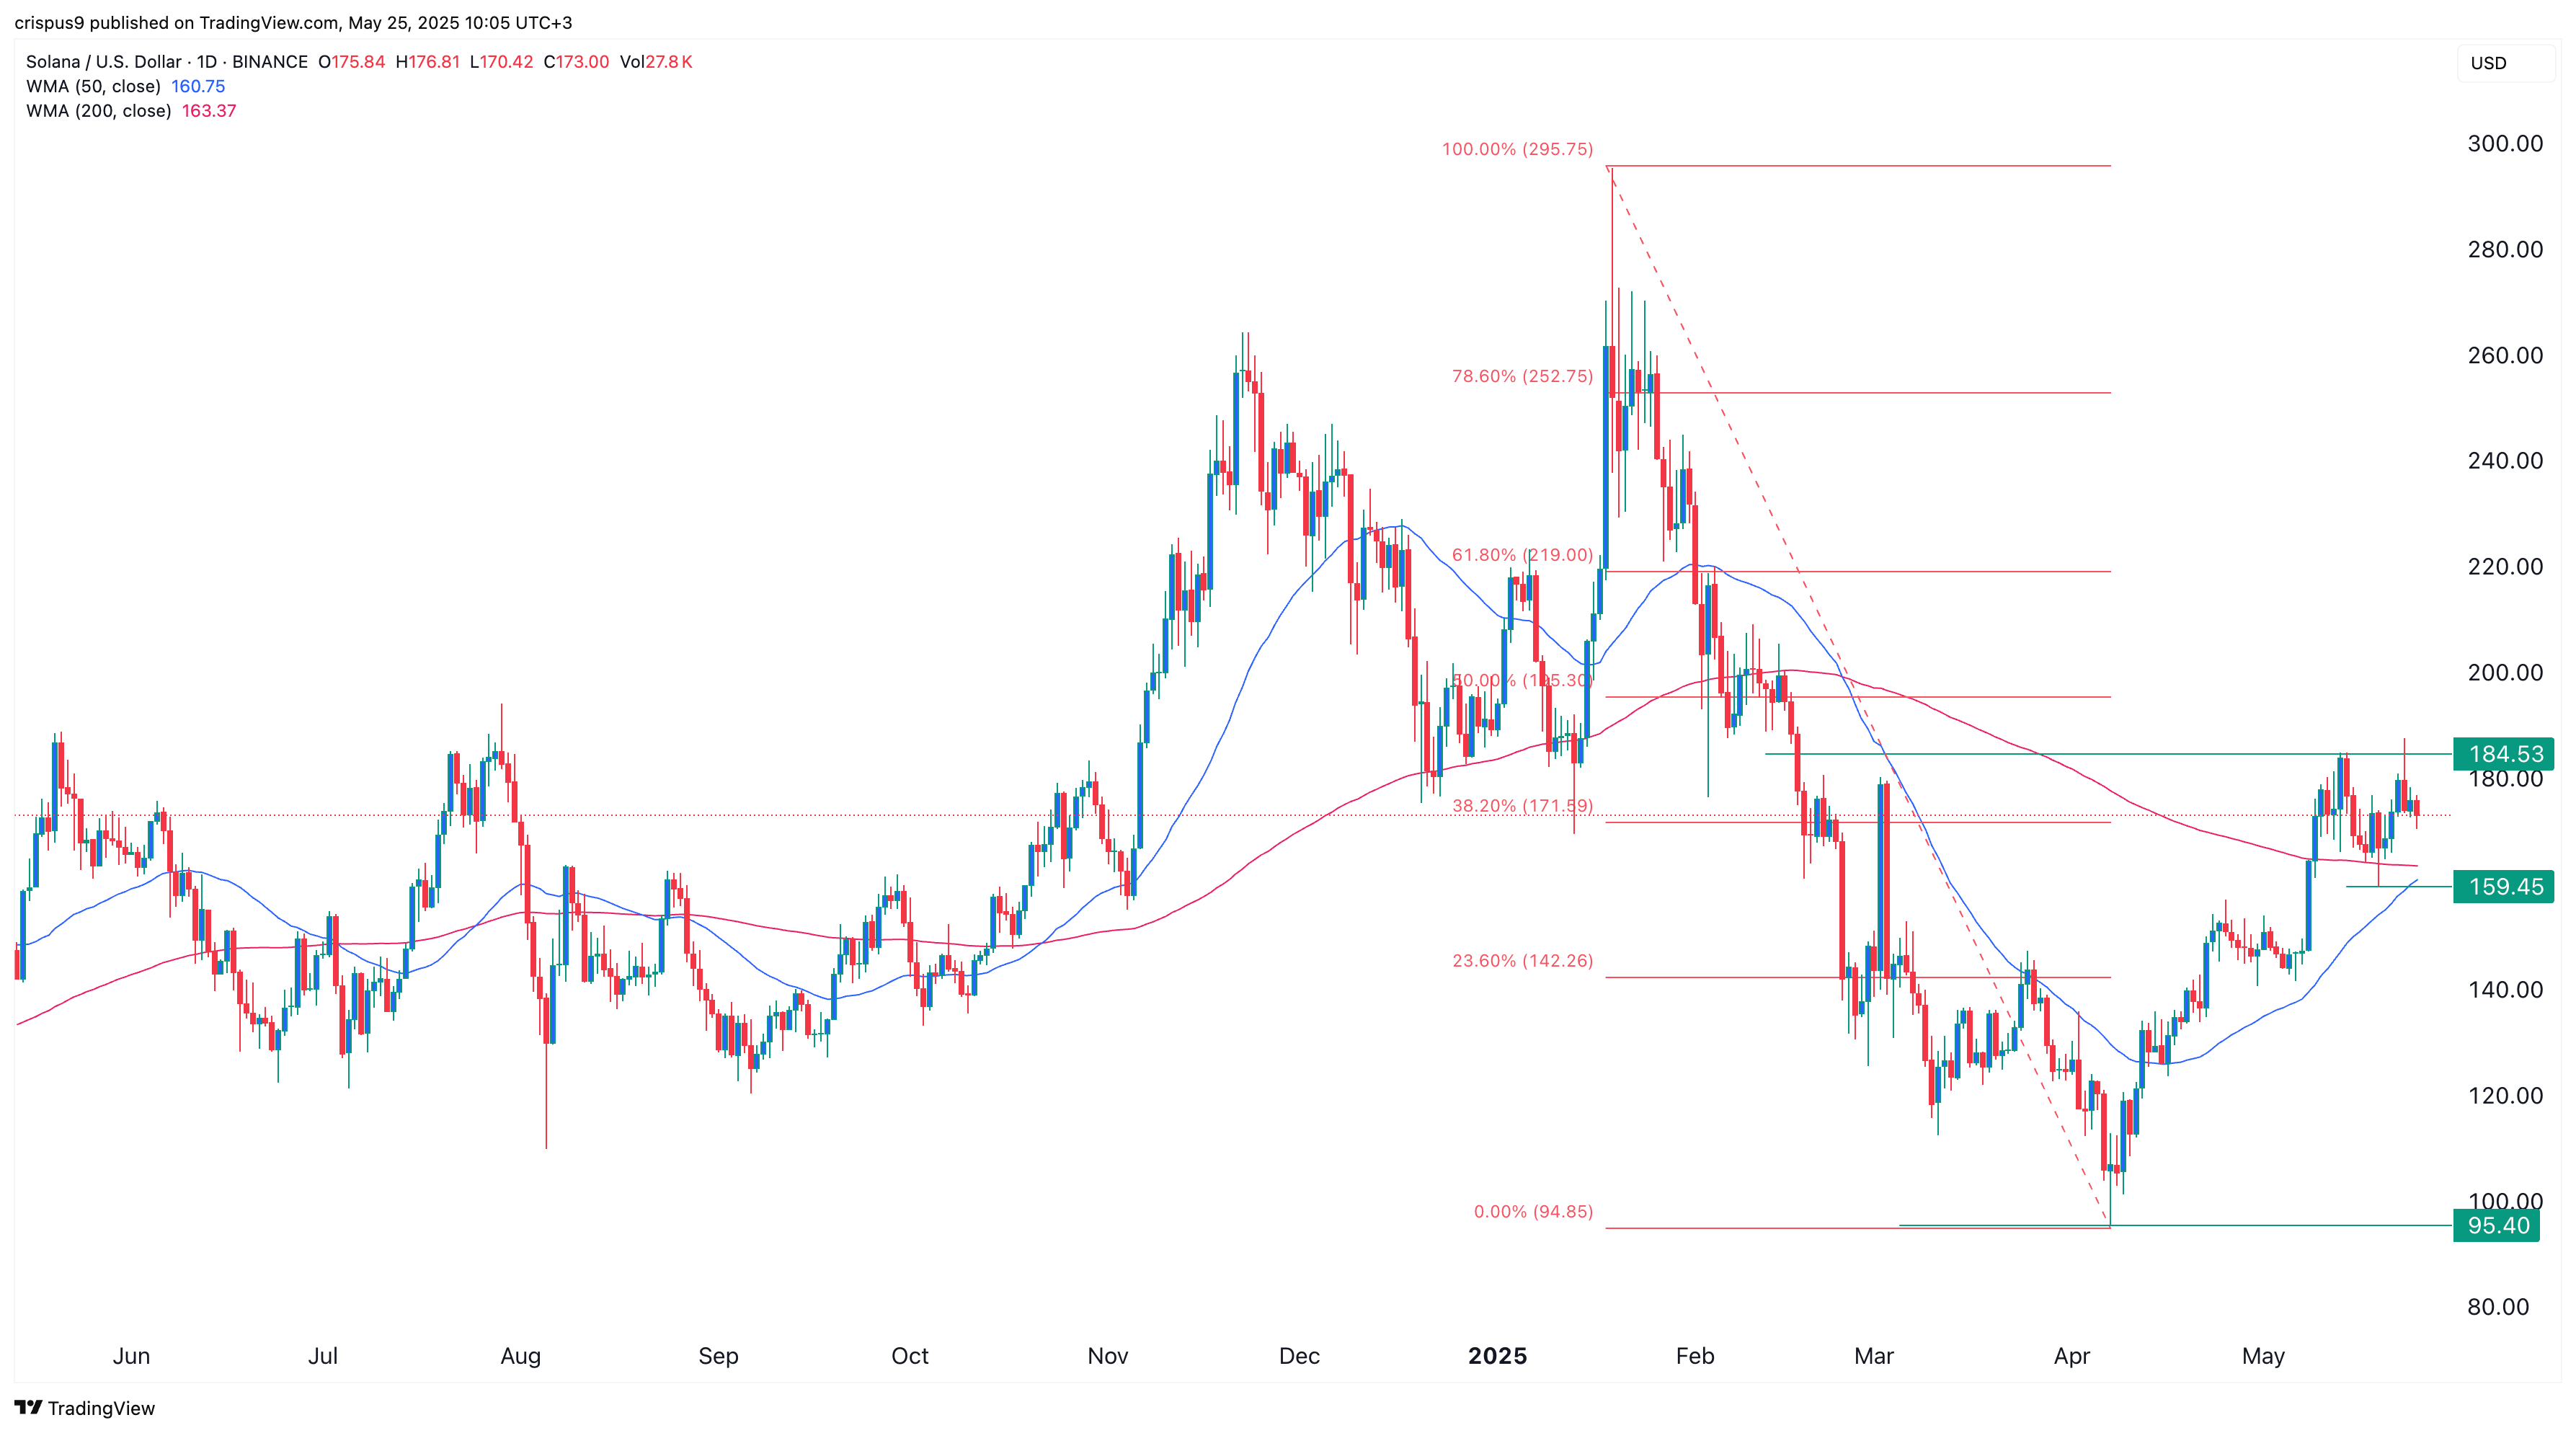
The daily chart shows the SOL price bottomed at $95.40 in April as concerns about its meme coins rose. It then rebounded to a high of $185 as other altcoins rallied.
Solana has formed a small double-top pattern at $184.53 and a neckline at $159.45. A double-top is a popular bearish reversal pattern.
On the positive side, the coin is about to FORM a golden cross pattern as the 50-day weighted moving average crosses the 200-day average. This pattern often leads to a strong bullish breakout.
Therefore, the most likely Solana price forecast is bullish as long as it moves above the resistance at $184.53. Such a move will see it rise to the psychological point at $200, which is slightly above the 50% retracement level.
