Bitcoin Bounces Off Support – Bull Flag Hints at $125K Breakout

BTC slams the brakes at a key demand zone—traders now eyeing a potential 2x surge as market structure flips bullish.
Forget ’buy the dip’—this is ’buy the last chance’ territory. Technicals scream accumulation, but Wall Street won’t notice until the FOMO kicks in at $100K.
Pro tip: When your Uber driver starts quoting Fibonacci retracements, it’s time to check your stop-loss.
Key technical points
- Support: $106,133 high-timeframe support holding price action
- Structure: BTC trading within a rising high-timeframe price channel
- Target: $125,400 channel high remains the next logical resistance
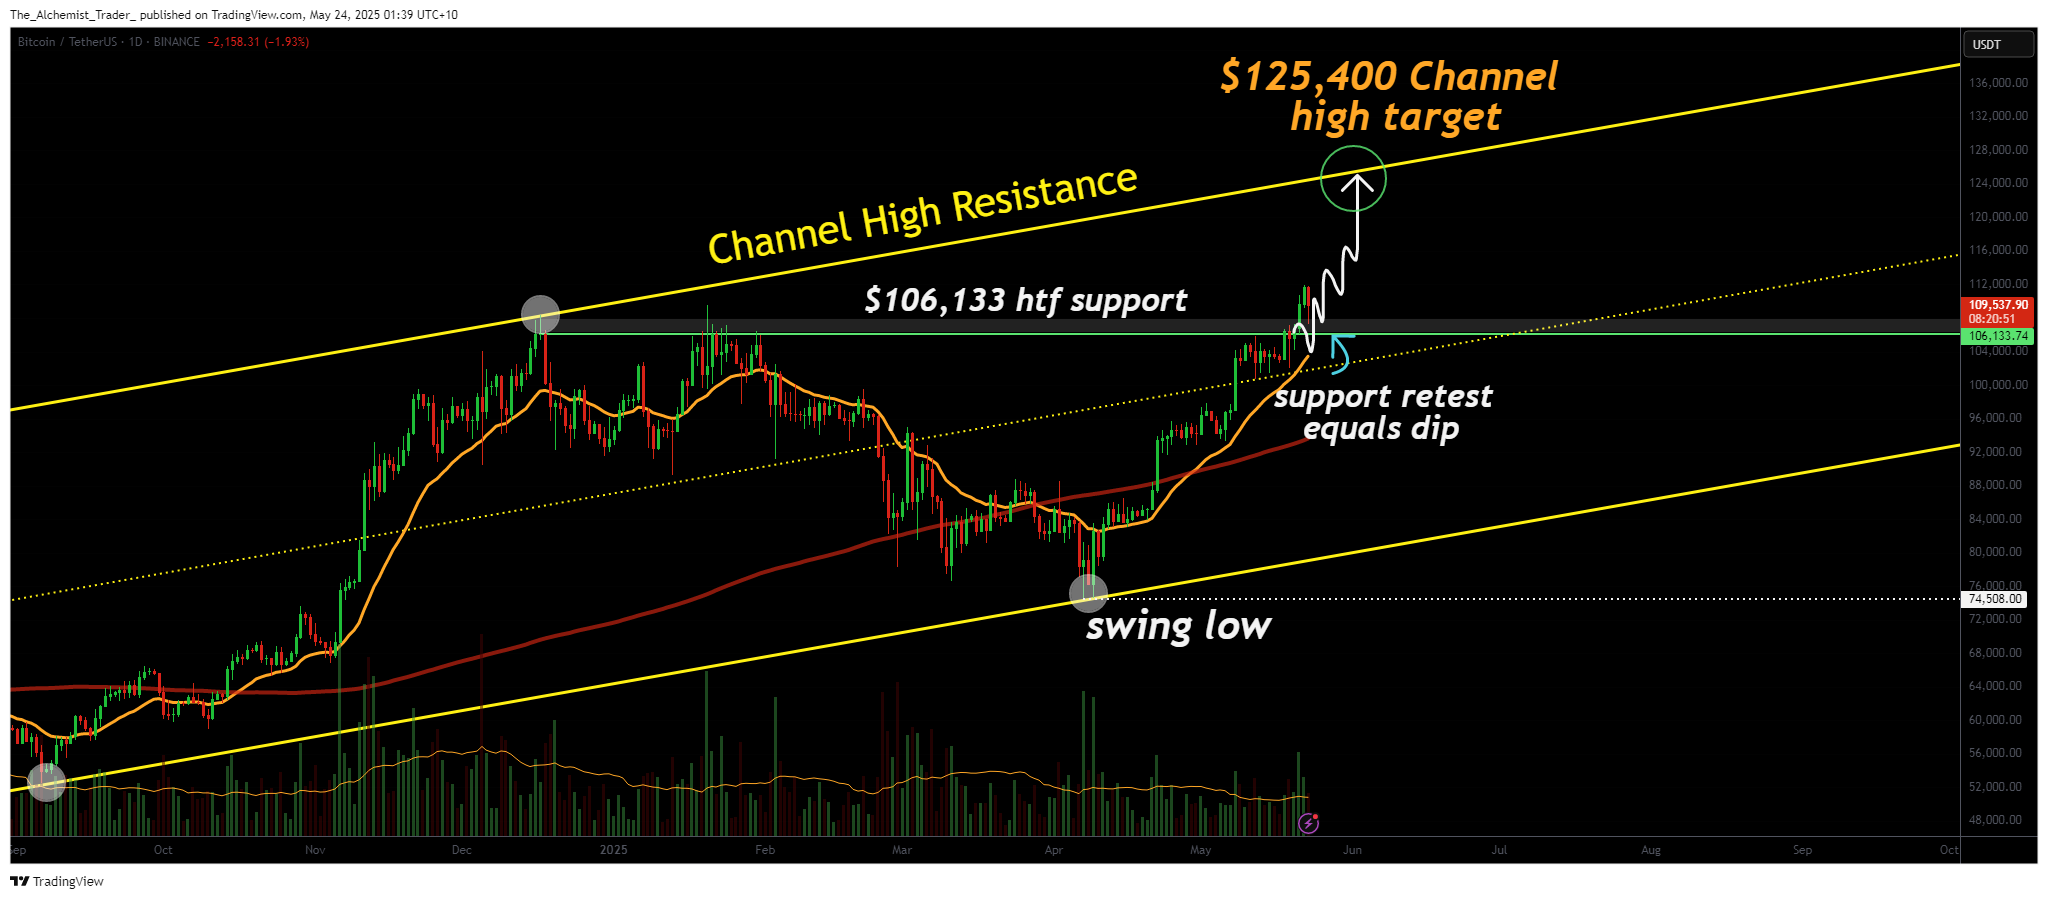
Bitcoin’s decline from recent local highs triggered a wave of intraday selling pressure, but the correction landed precisely at a high-timeframe support level near $106,133. This region has historically served as a key inflexion point, where price has either consolidated or reversed to resume its upward trend. The reaction at this level will be crucial in determining whether Bitcoin can maintain its bullish posture.
From a structural standpoint, bitcoin remains inside a well-defined upward channel. Previous moves within this channel have respected both the upper and lower bounds, bouncing cleanly between support and resistance. The recent pullback aligns with the lower boundary of this channel, suggesting a potential rotational move back toward the upper boundary at $125,400.
Supporting this bullish outlook is the fact that no major breakdown in market structure has occurred. The most recent swing low remains intact, and the price is still printing higher lows on higher time frames. If Bitcoin consolidates above current support and builds momentum, a continuation toward $125,400 becomes the base case scenario.
In the short term, traders should monitor how the price behaves between $106,133 and $110,000. Holding above the lower boundary will invite more buying pressure and could lead to the breakout required for the next leg up. On the flip side, a confirmed loss of $106K WOULD invalidate this structure and shift momentum in favor of sellers.
What to expect in the coming price action
As long as Bitcoin holds above the $106,133 support level, price action is likely to grind higher toward the $125,400 resistance level. Short-term volatility may continue, but the broader structure remains firmly bullish for now.
Disclosure: This article does not represent investment advice. The content and materials featured on this page are for educational purposes only.

Log in to Reply
Log in to comment your thoughtsComments
Related Articles
|Square
Get the BTCC app to start your crypto journey
Get started today Scan to join our 100M+ users