XLM Bounces Off Support With 1.17% Surge—Analysts Eye $0.35 as Next Target

Stellar’s XLM defies market lethargy with a decisive rebound from critical support levels. Traders are now positioning for what could be a 30% climb if bullish structure holds.
The Technical Setup
Tuesday’s bounce wasn’t just another dead-cat bounce—it came on strong volume, confirming institutional interest at these levels. The $0.25 support zone has now been tested three times since April, creating what chartists call a ’triple bottom’ (Wall Street’s fancy term for ’we’ve run out of sellers’).
The Road to $0.35
Breaking through the $0.30 resistance would open the floodgates. With RSI cooling off from overbought territory and MACD showing renewed bullish divergence, the stars might actually align for XLM holders—for once.
The Catch
Of course, this being crypto, the ’bullish structure’ could evaporate faster than a hedge fund’s morals during a market crash. But for now, the charts are whispering ’buy’—just don’t tell the SEC we said that.
Key technical points
- Key Support Reclaimed: The $0.20 level, resistance since April 2022, has been flipped into support.
- Bullish Market Structure: Price is forming a rising channel with higher highs and higher lows.
- Confluence of Support: XLM is bouncing off a zone supported by the 200-day MA, point of control (POC), and channel trendline.
- Volume Behavior: Declining volume at support often precedes an influx, which could propel price upward.
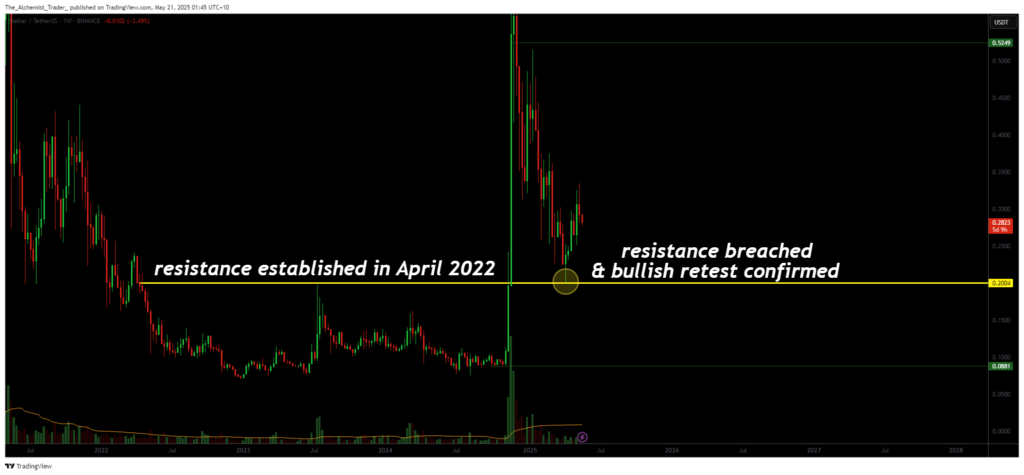
XLM’s technical structure is favoring the bulls following a confirmed bullish retest of the $0.20 level, a resistance that had suppressed price since Q2 of 2022. This high-timeframe breakout is significant. Not only has the level held as support throughout 2025, but it also aligns with a broader market shift in sentiment.
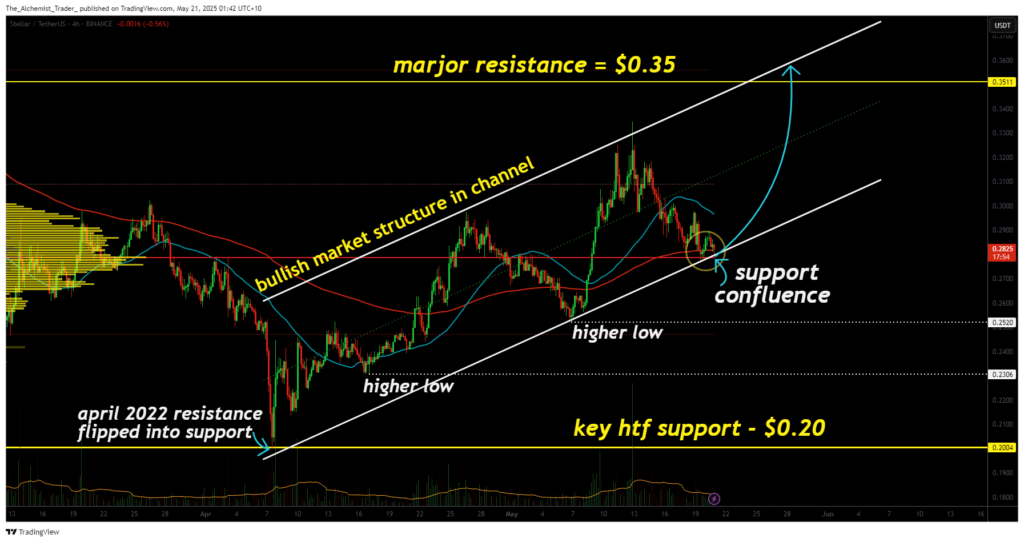
From a structural standpoint, the asset is making a series of higher lows and higher highs, confirming an uptrend. On the intraday charts, price is trading within a bullish ascending channel, currently testing the lower boundary, a level supported by the 200-day moving average and the POC. These technical markers strengthen the credibility of this zone as a strong demand area.
A bounce from here is already underway, with a 1.17% uptick, but this could just be the beginning. Volume has declined at the support zone, a behavior often observed before a strong directional move. If the next influx is dominated by buyers, XLM could accelerate toward the next major resistance at $0.35, a level that hasn’t been tested since late 2023.
What to expect in the coming price Action
If support at $0.20 continues to hold and is followed by a volume-backed move, XLM could rally toward the $0.35 region in the short term. With bullish structure in place and key levels aligned, the outlook remains positive unless key supports break down.
