AAVE Surges 25% as Golden Cross Looms—DeFi’s Latest Bull Trap or Breakout?

AAVE rockets past key resistance as its 50-day MA prepares to cross the 200-day—classic trader bait. Will this DeFi darling sustain momentum or become another ’wen lambo’ gravestone?
Technical analysts are drooling over the chart setup, while skeptics note the pattern’s 60% historical accuracy (but who needs stats when hopium’s free?). The rally coincides with fresh institutional interest—just in time for the usual ’buy the rumor, sell the news’ circus.
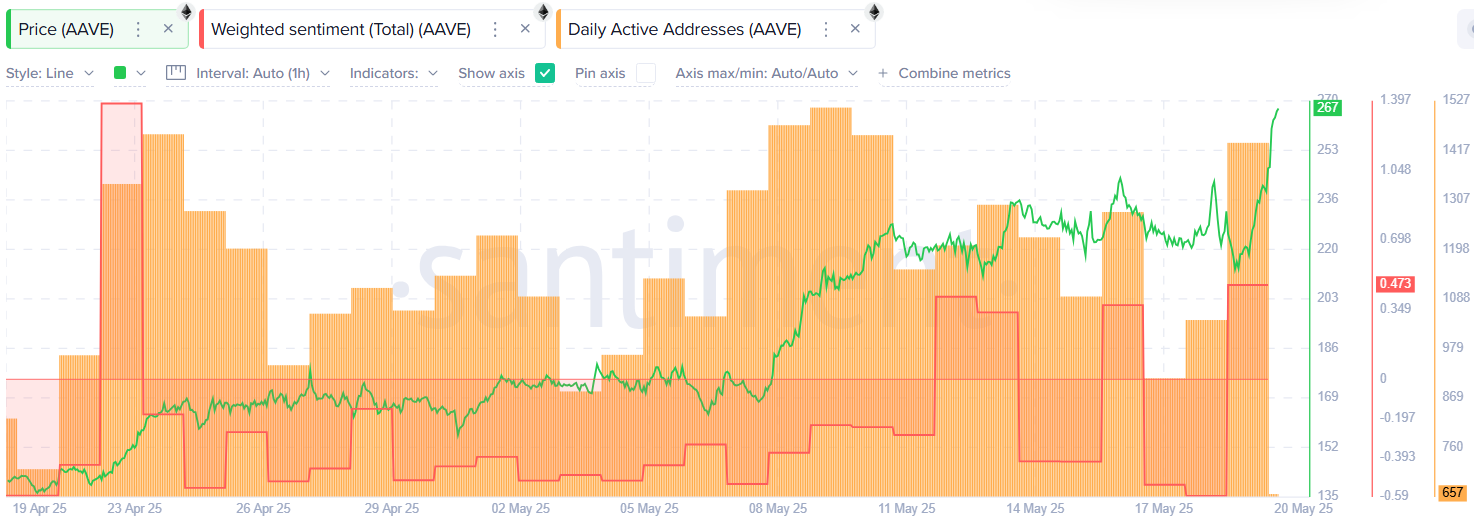 Source: Santiment
At the same time, its weighted social sentiment has also flipped positive, a sign that market participants are growing bullish on AAVE’s short-term outlook.
Potential golden cross in development
On the 1-day/USDT chart, the Aroon Up indicator is at 100% while Aroon Down sits at 0%, meaning bullish momentum is dominant. The Chaikin Money FLOW Index is reading 0.26, which signals more capital flowing into the token.
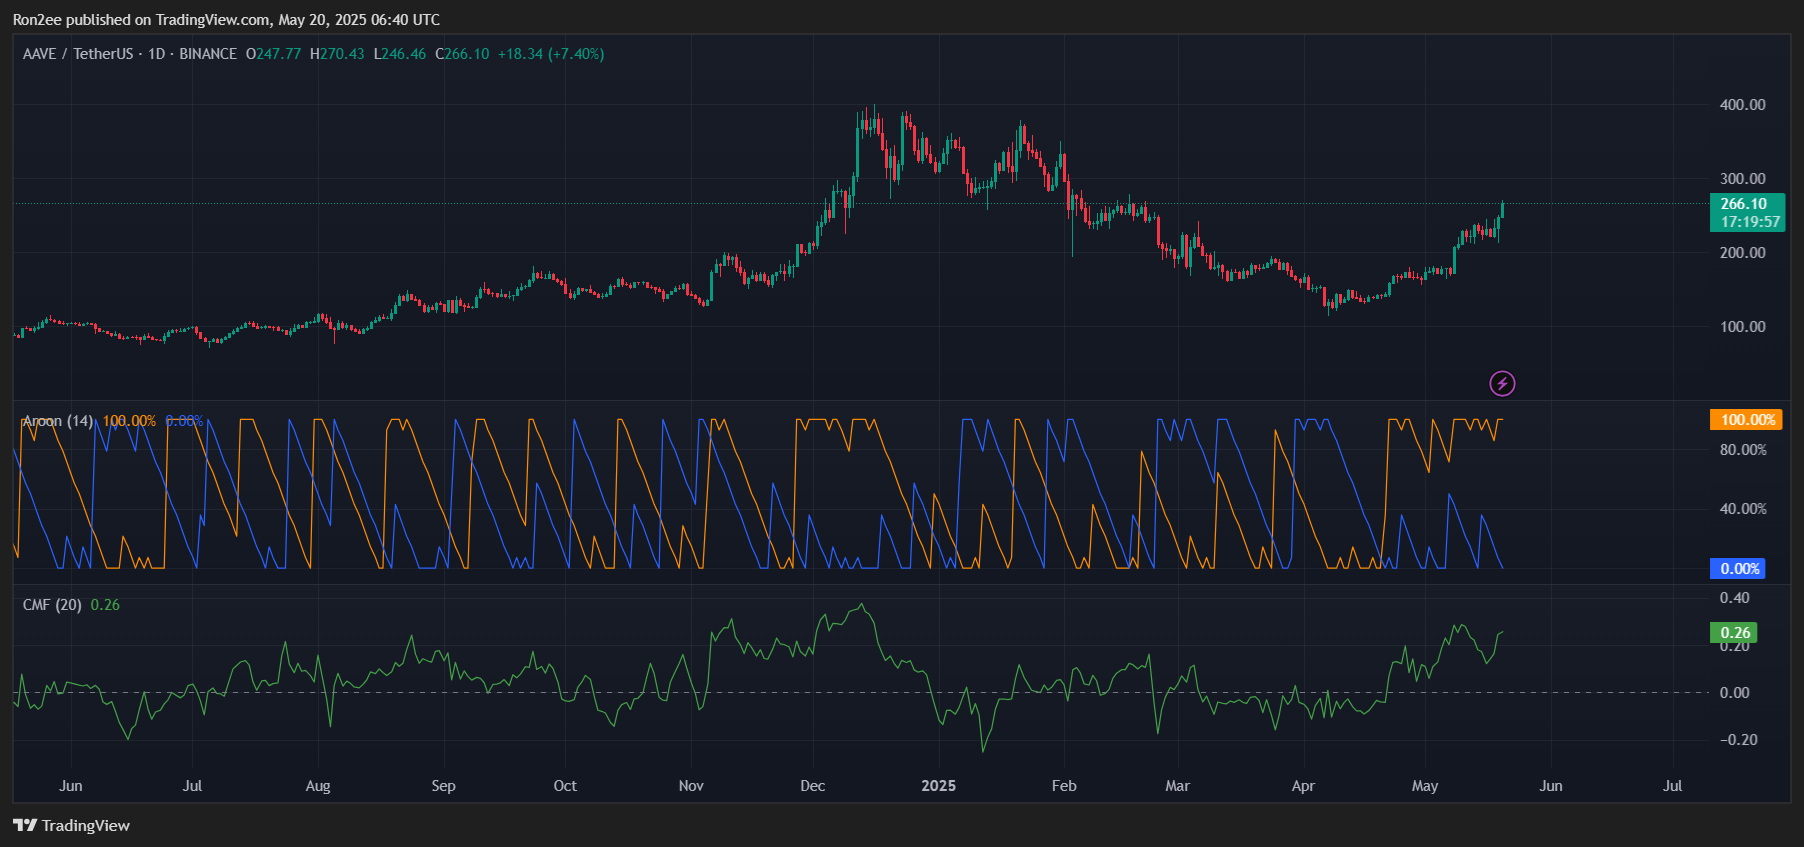
A golden cross also looks imminent on the daily chart, as AAVE’s 50-day and 200-day moving averages inch closer to a crossover, often considered a bullish signal.
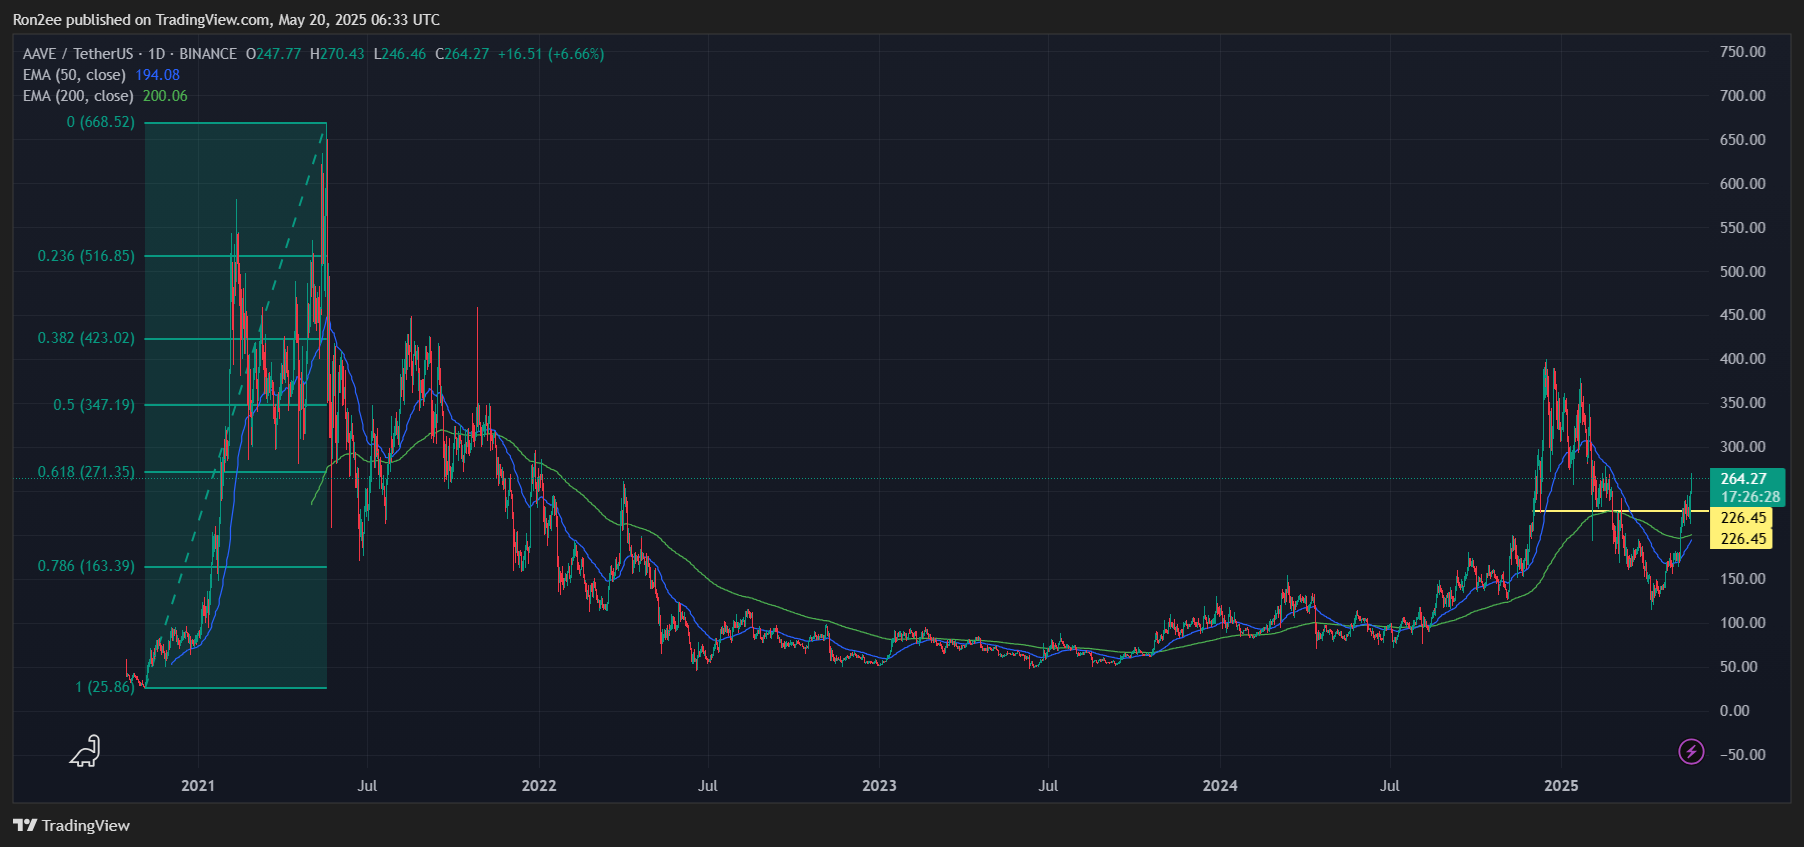
The token is nearing the 61.8% Fibonacci retracement level at $271.35. A clean breakout above this level could pave the way toward the 50% retracement level at $347.19, roughly 30% higher than current levels.
On the flip side, if a pullback happens, key support lies NEAR $226.45, which could serve as a solid bounce zone before the uptrend resumes.
At press time, AAVE was trading around $267 per coin.
Disclosure: This article does not represent investment advice. The content and materials featured on this page are for educational purposes only.

Log in to Reply
Log in to comment your thoughtsComments
Related Articles
|Square
Get the BTCC app to start your crypto journey
Get started today Scan to join our 100M+ users