Bitcoin Dips—But Analysts Spot the Telltale Lull Before a Volatility Surge

Bitcoin’s price slides under $65K—classic ’coiling spring’ pattern flashes on charts. Traders whisper ’bull trap,’ while institutions quietly accumulate.
Technical outlook: The tighter the consolidation, the louder the breakout. RSI neutrality screams indecision, but derivatives markets tell a different story—open interest climbing as whales position for the next move.
Meanwhile, Wall Street’s latest ’stablecoin’ project just burned $200M in development costs. Some things never change.
Bitcoin price chart points to more gains
crypto.news made a bullish bitcoin price forecaston Wednesday, pointing to the cup-and-handle pattern on the daily chart.
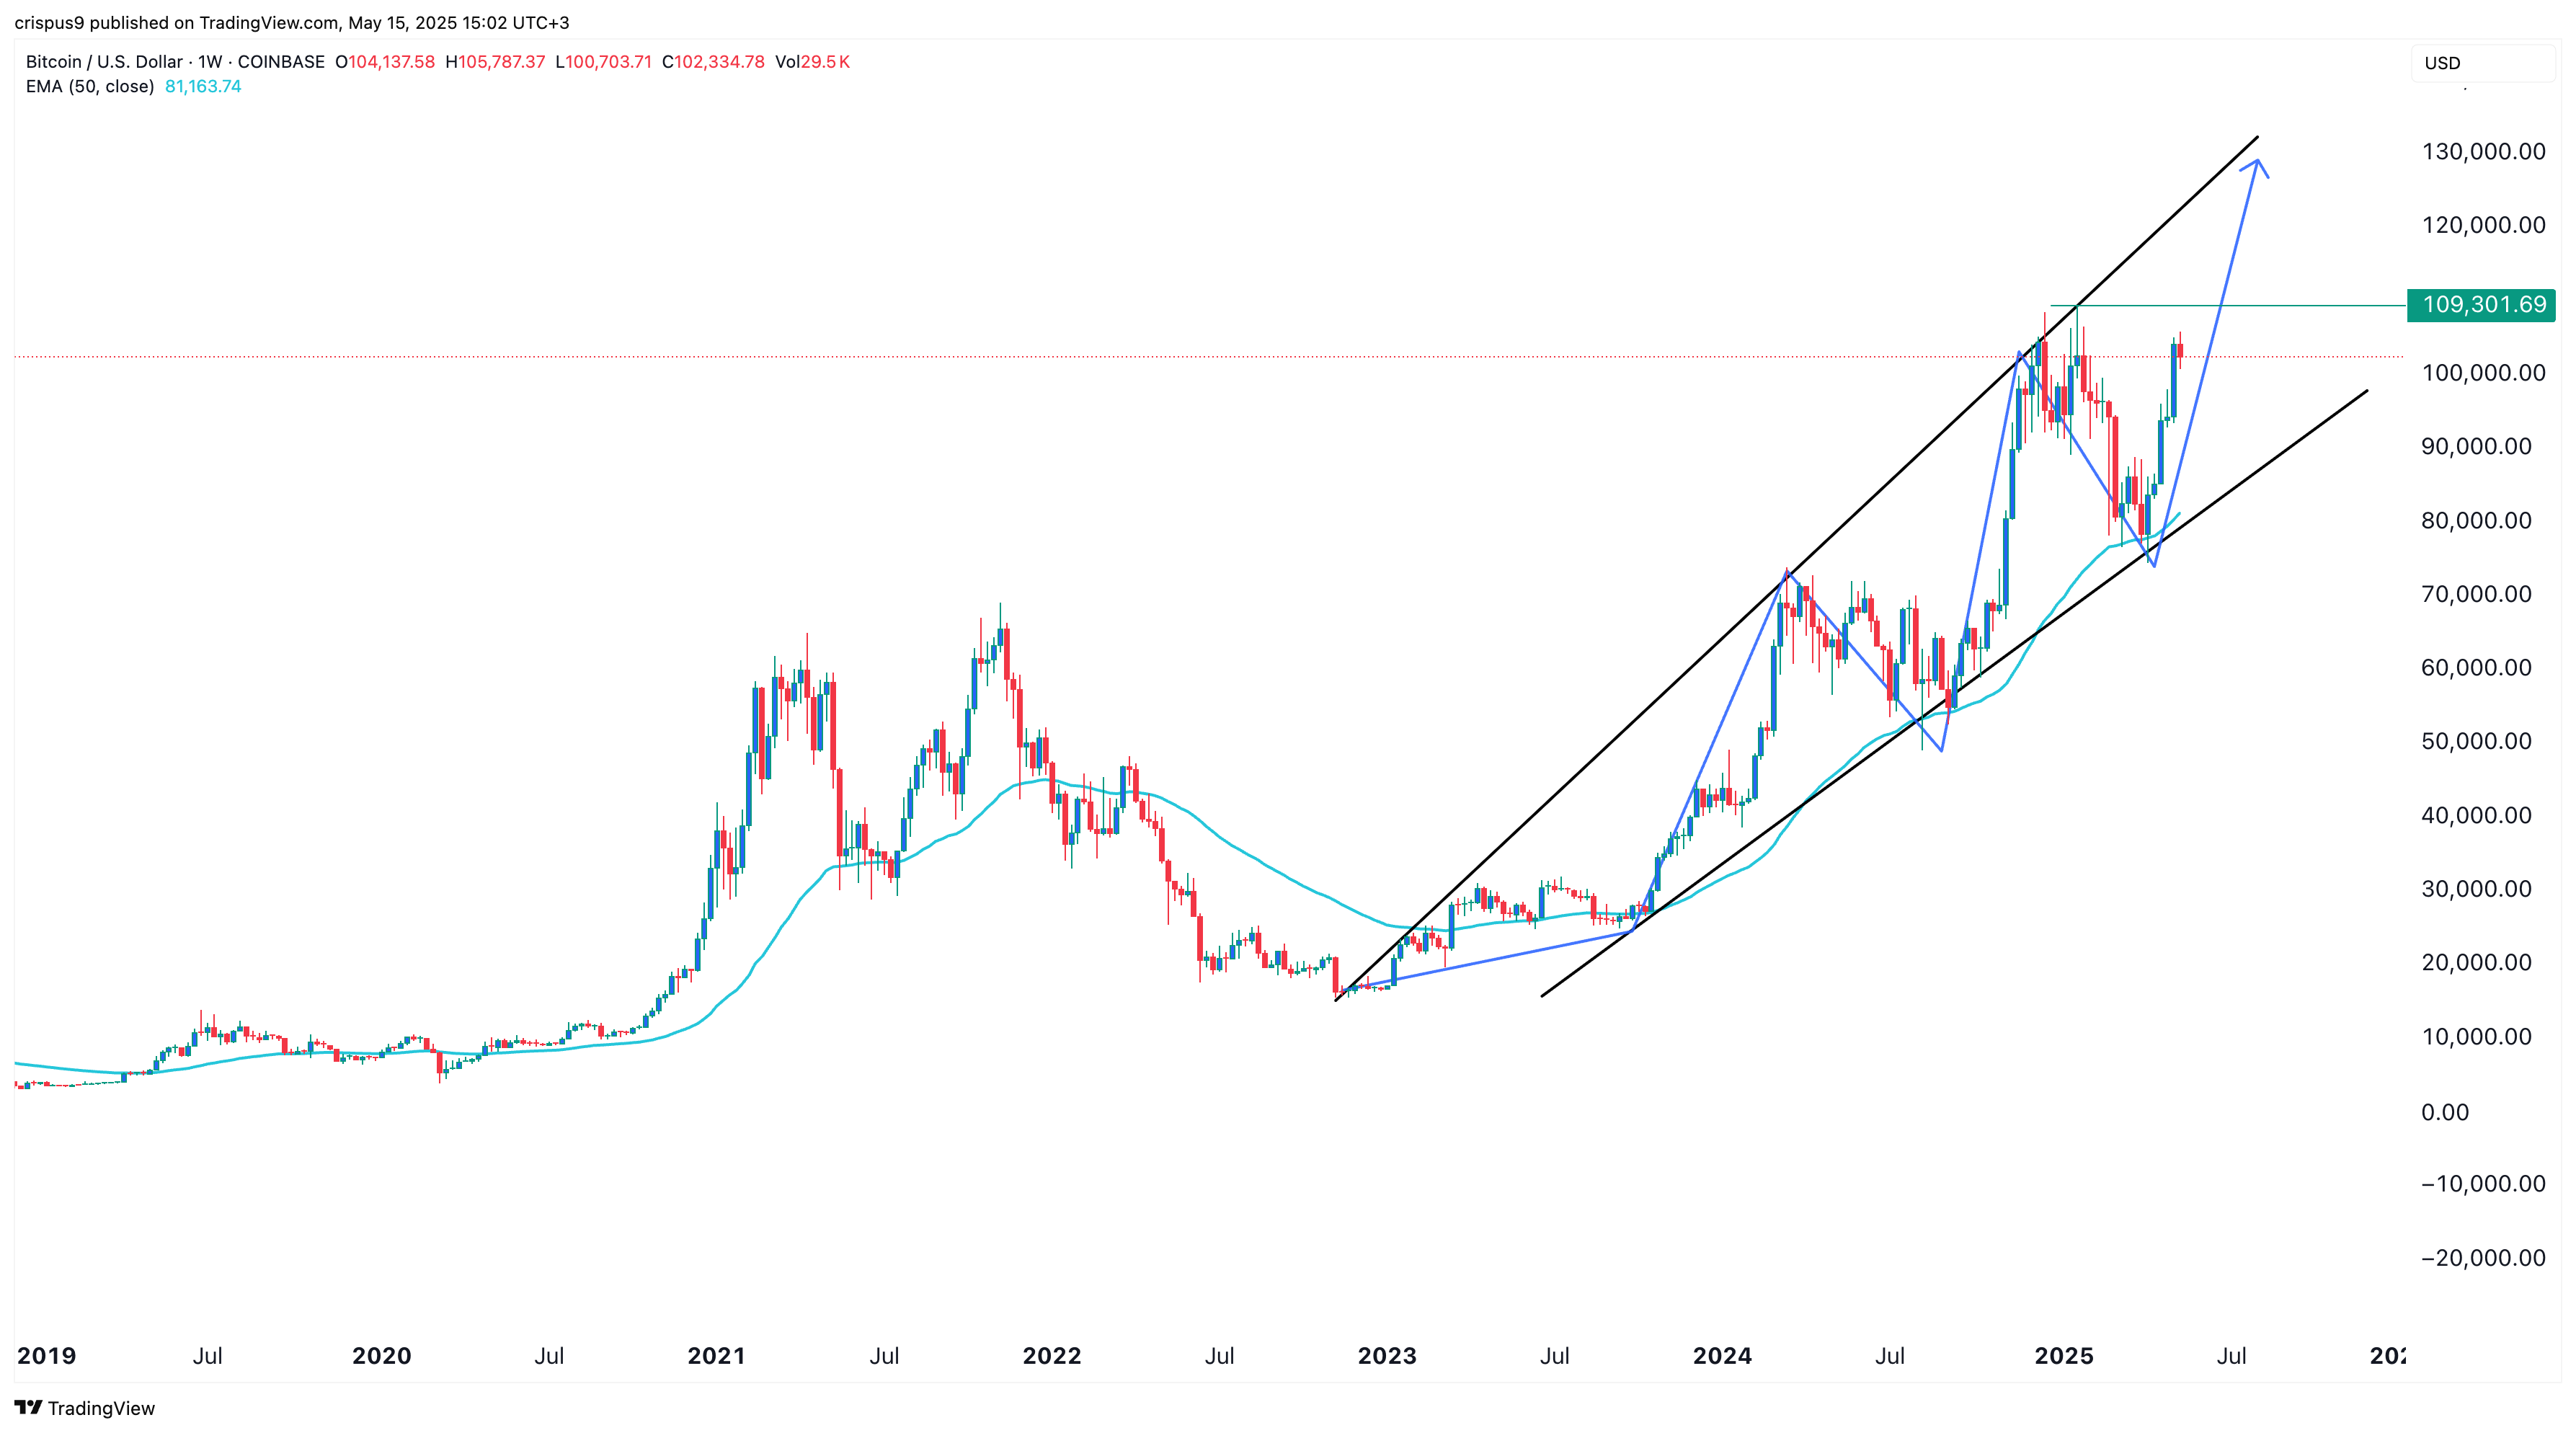
The weekly chart suggests further gains in the coming months. It shows that Bitcoin’s price has consistently remained above the 50-week Exponential Moving Average and has not moved below it since October 2023.
Bitcoin has also formed a giant megaphone pattern, composed of two rising and diverging trendlines. This pattern often precedes a strong bull run. In this case, the rally will be confirmed if price breaks above the all-time high of $109,300.
If that happens, the next level to watch will be the psychological barrier at $110,000, followed by $115,000. However, the bullish forecast WOULD be invalidated if the coin drops below the lower boundary of the megaphone pattern.

Log in to Reply
Log in to comment your thoughtsComments
Related Articles
|Square
Get the BTCC app to start your crypto journey
Get started today Scan to join our 100M+ users