Bitcoin’s Bullish Signal: Exchange Outflows Spark $145K Price Target

Whales are moving BTC off exchanges—a classic accumulation pattern that historically precedes major rallies. On-chain data shows the last time outflows hit this level, Bitcoin ripped 300% in six months.
Technical analysts point to a textbook Wyckoff accumulation phase completing, with the measured move target landing squarely at $145K. Meanwhile, Wall Street’s ’regulated’ crypto products just saw their 17th consecutive week of outflows—but sure, keep trusting those custody agreements written by bank lawyers.
If the pattern holds, we’re looking at a potential 2.5X surge from current levels. The only thing rising faster than Bitcoin’s price? The irony of TradFi institutions FOMO-ing into the asset they spent a decade mocking.
Bitcoin price technical analysis
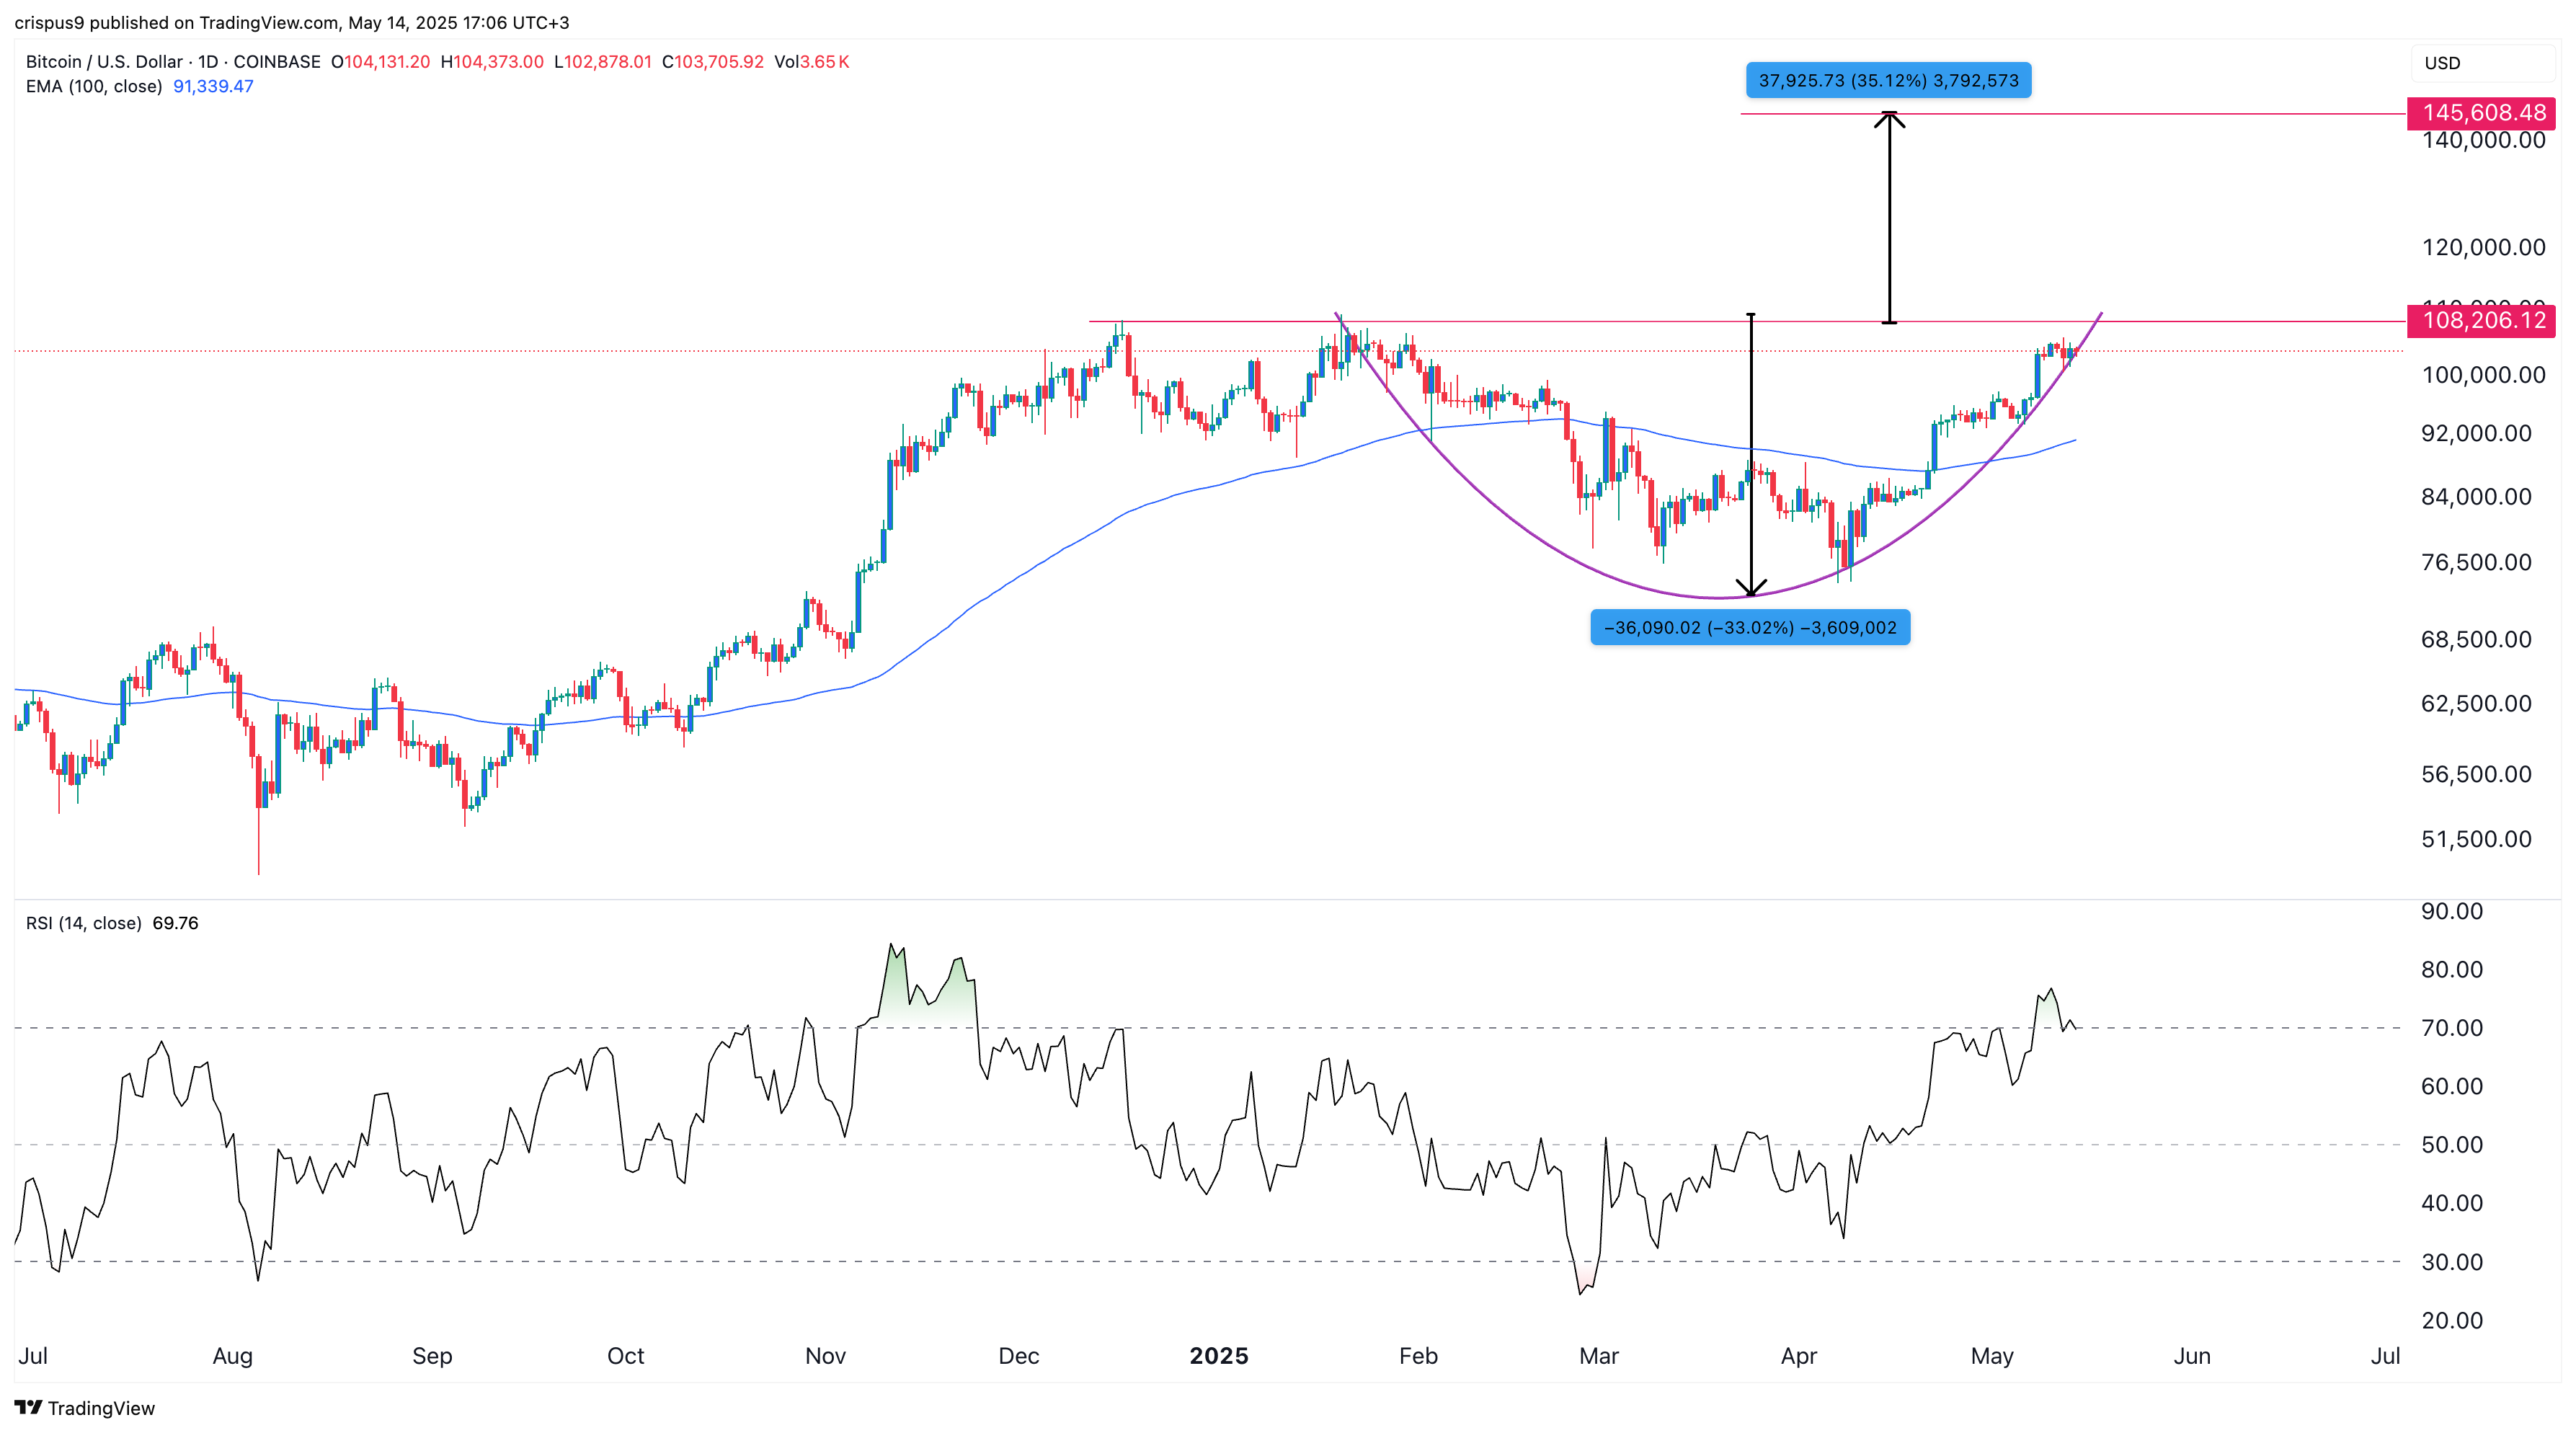
The daily chart shows that Bitcoin is gradually forming a cup-and-handle pattern, with the upper boundary at $108,200. A C&H pattern is a popular continuation signal in technical analysis.
This particular pattern has a depth of about 33%. Measuring the same distance from the cup’s upper side suggests a potential rally to $145,000. The bullish outlook will be confirmed once the BTC price breaks above the cup’s upper boundary.
On the flip side, a drop below the 100-day moving average at $91,340 would invalidate the bullish outlook.
