VIRTUAL Coin Primed for 375% Rally as Rare Chart Pattern Emerges—Smart Money Already Loading Up

Forget the ’buy low, sell high’ mantra—the whales are feasting on VIRTUAL while retail traders still think it’s a meme coin. A textbook bullish pattern just triggered, and history says this one’s got legs.
Here’s why the charts (and the big wallets) scream upside:
- The ’Golden Cross’ just appeared on VIRTUAL’s weekly chart—a freakishly accurate predictor of past crypto runs
- On-chain data shows exchange reserves draining fast—when coins leave exchanges, they’re not coming back for quick sales
- Funding rates remain neutral despite the pump—no overheated leverage yet means room to run
Of course, in crypto-land, ’technical analysis’ is just astrology for MBAs. But when the pattern matches Bitcoin’s 2016 breakout right before its 20,000% tear? Even the cynics are paying attention.
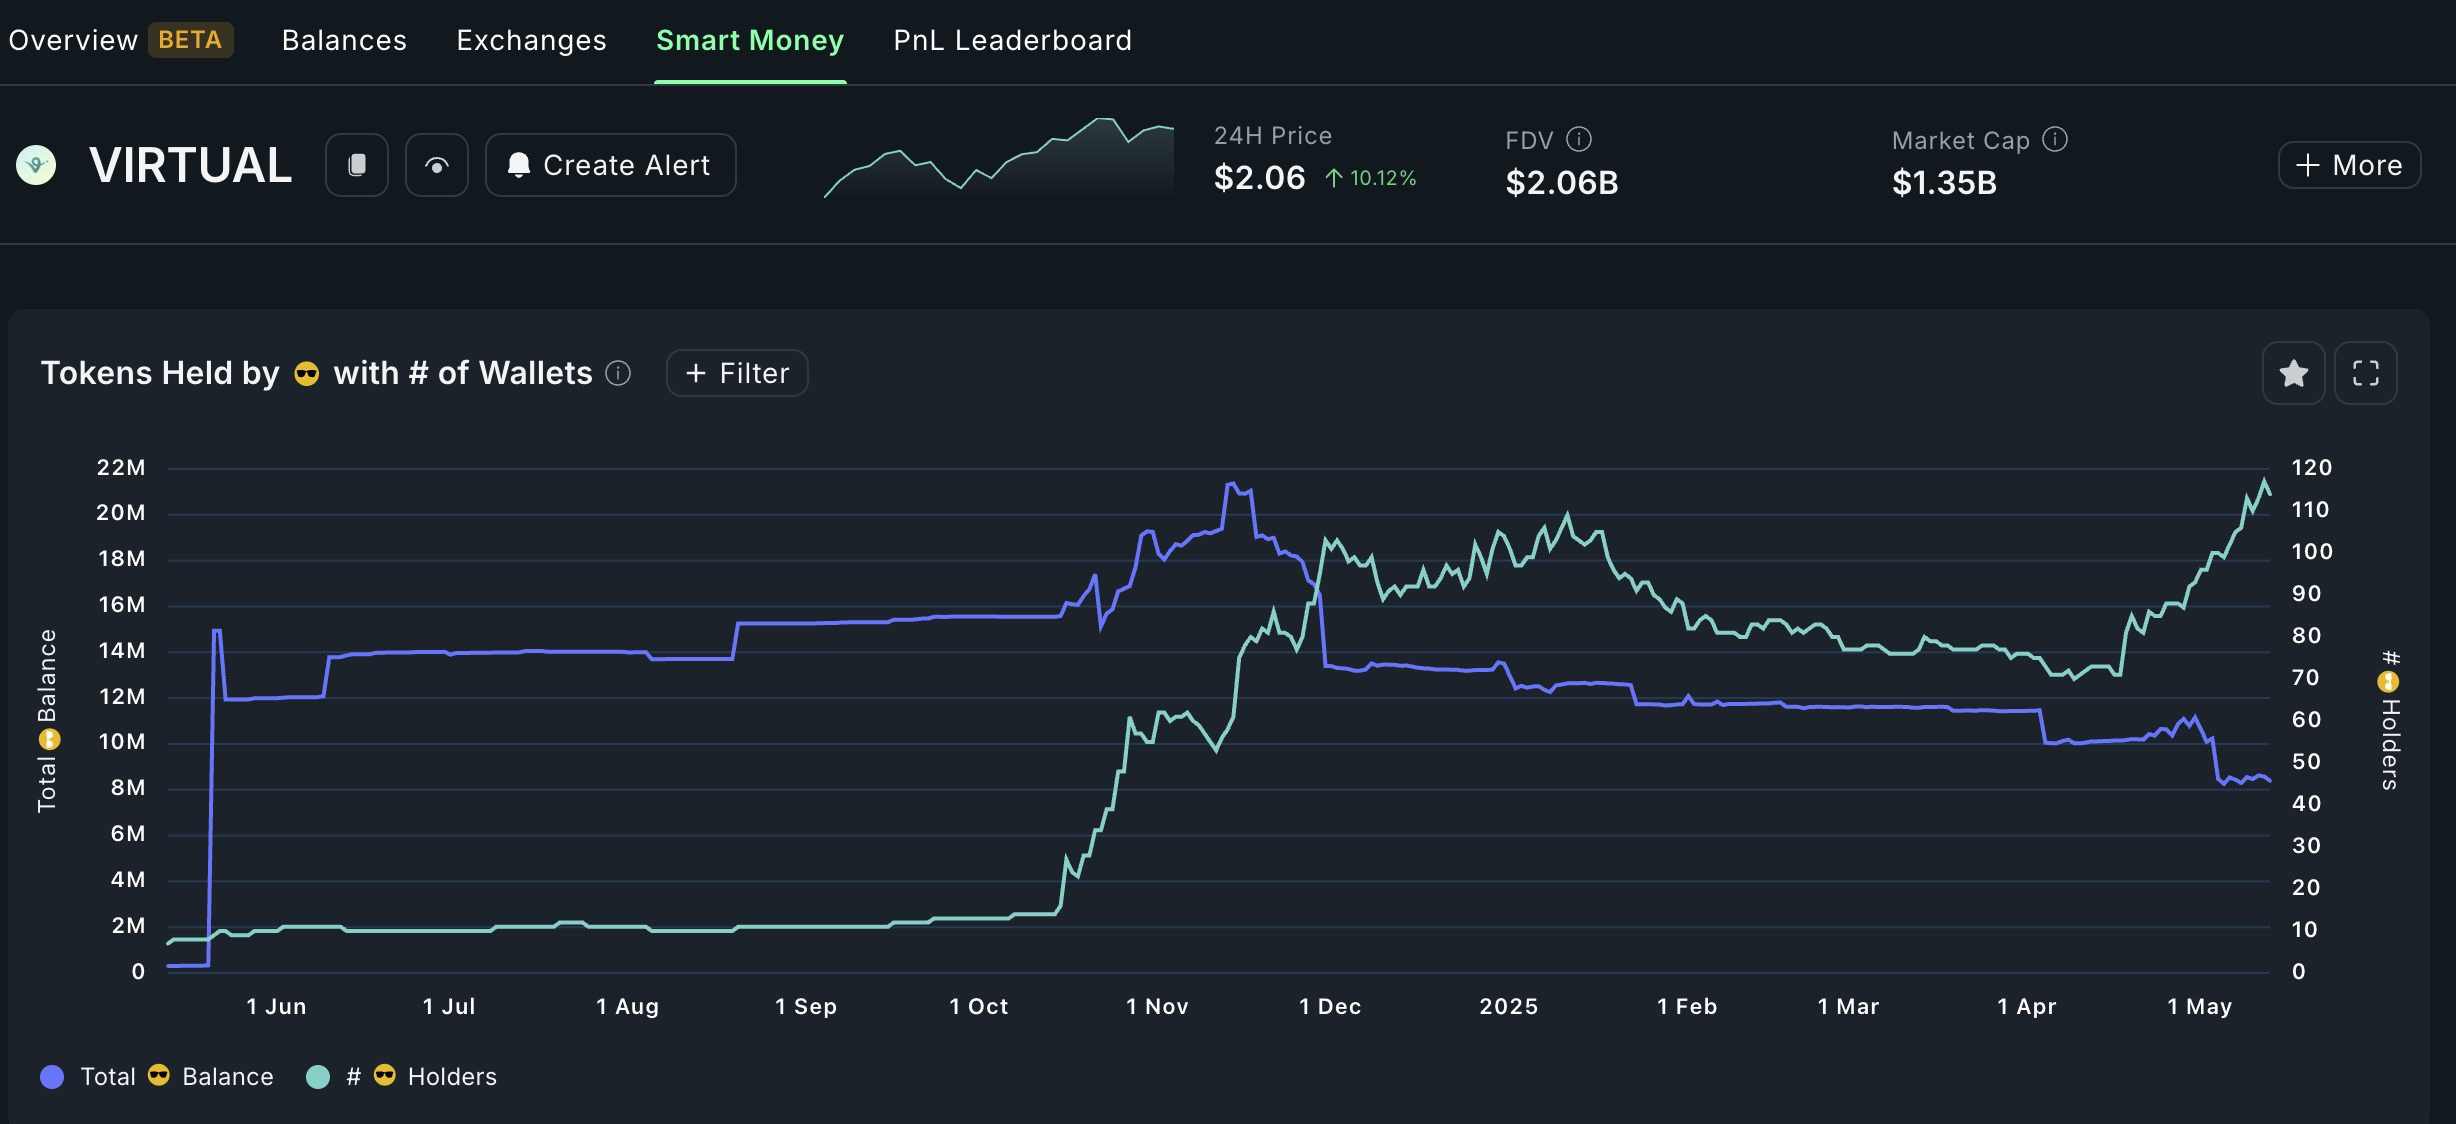 VIRTUAL smart investors | Source: Nansen
Smart money investors are normally seen as being more sophisticated and experienced than retail investors. As such, their purchases are a sign that they expect the coin’s price to keep rising in the coming weeks.
Additional Nansen data shows that the net FLOW to exchanges in the last seven days was negative 7.2 million tokens. A negative net flow indicates that more coins are being withdrawn from exchanges than deposited, a sign that investors are confident the coin will continue performing well.
VIRTUAL price technical analysis
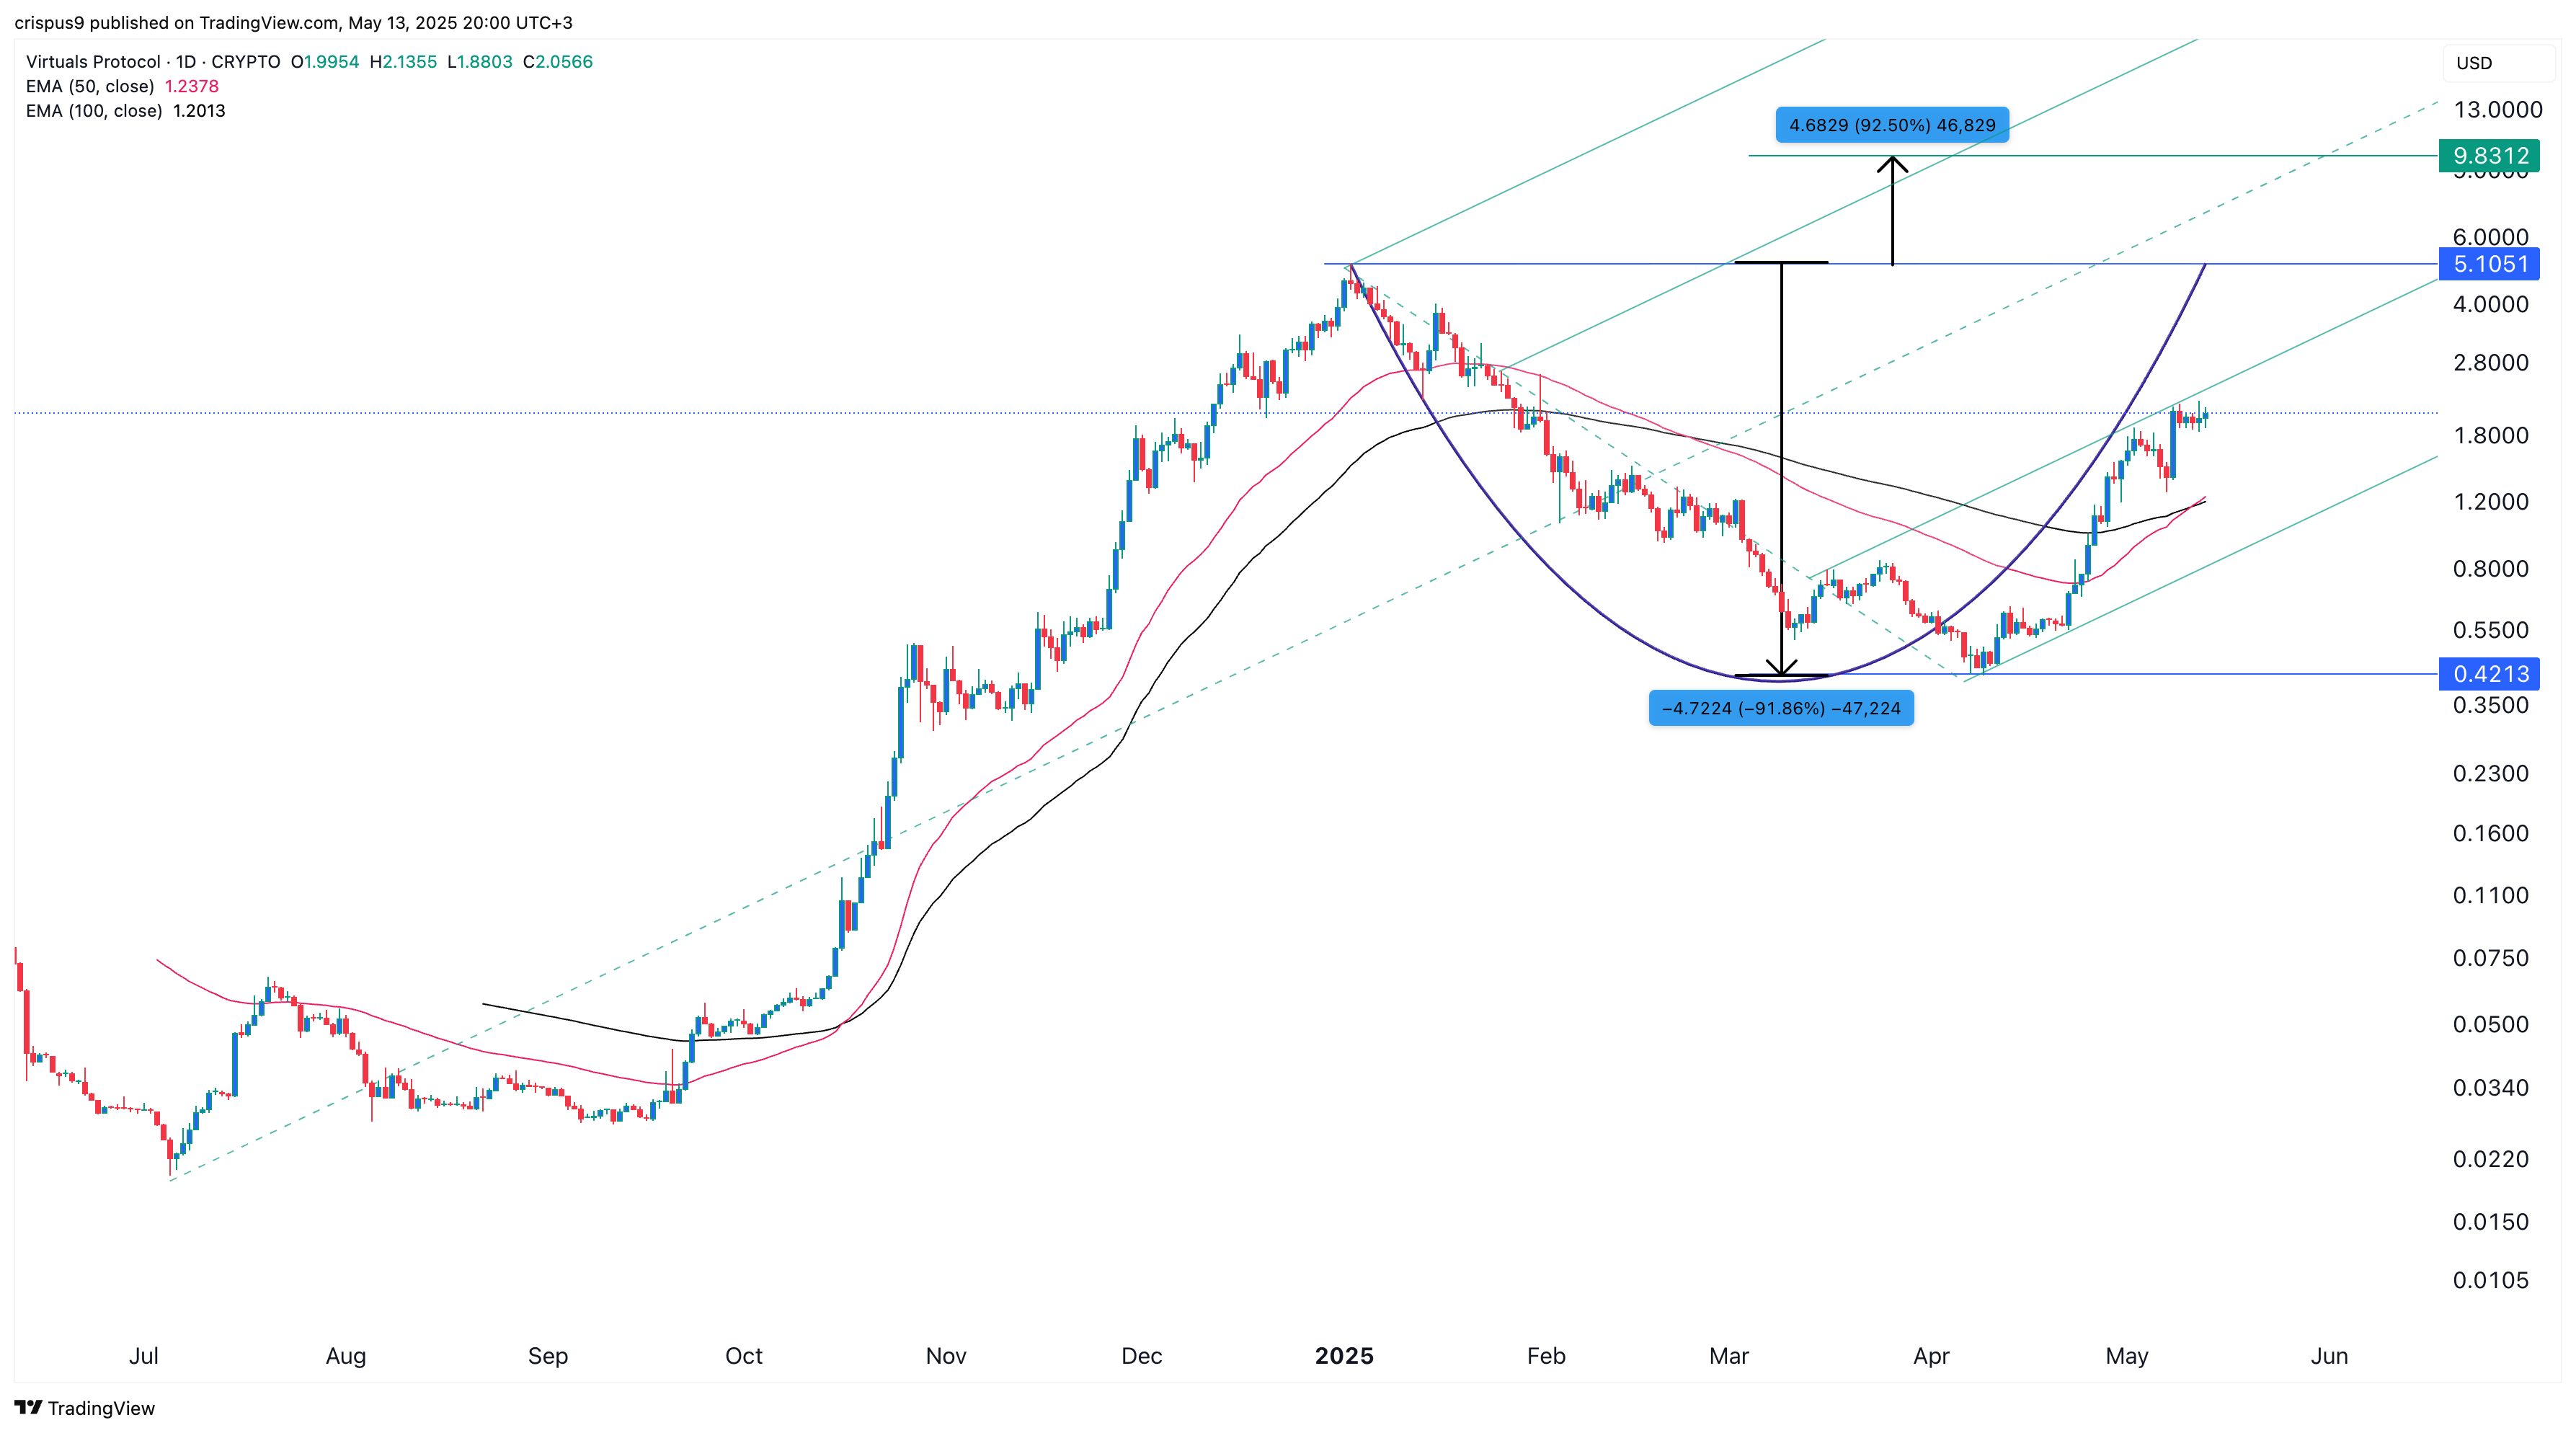
The daily chart shows that the VIRTUAL price bottomed at $0.4213 in April and has rebounded by over 375% to $2.05. It has formed a mini golden cross as the 50-day and 100-day Exponential Moving Averages have crossed each other.
The Virtuals Protocol token also wants to cross the first support of Andrew’s Pitchfork tool. Most importantly, it is slowly forming a cup and handle pattern whose upper side is at $5.1050, which is 148% above the current level.
The cup has a depth of about 92%, meaning its potential target is $9.80, up 375% from its current level. This target is derived by measuring 92% of the cup’s upper side. A drop below the support at $1 will invalidate the bullish outlook.
