SEI Shatters Falling Wedge—Is This the Start of a Macro Rally?

SEI’s chart just pulled off a textbook breakout from a bearish pattern—now traders are scrambling to reposition. The falling wedge reversal signals potential double-digit upside if bulls hold this ground.
Key levels to watch: A clean break above $0.75 could trigger algorithmic buying, while failure to sustain momentum leaves SEI vulnerable to ’fakeout’ accusations from perpetually skeptical chartists.
Funny how these technical patterns always look bulletproof... until some hedge fund dumps 10,000 BTC to ’rebalance their portfolio.’
Key technical points
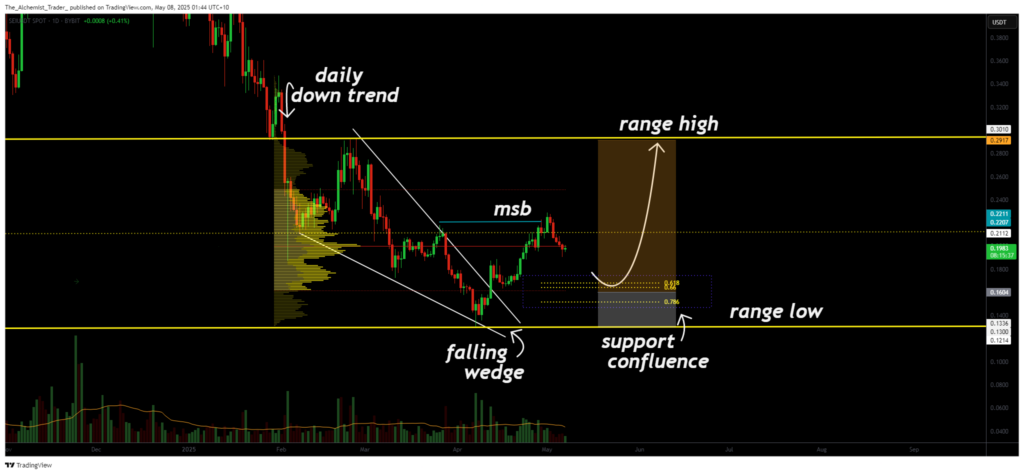
- Bullish Breakout: SEI has broken out of its falling wedge and confirmed a higher high, suggesting bullish reversal.
- Retest Zone: Price is expected to revisit the 0.618 Fibonacci retracement at the value area low to form a higher low.
- Upside Potential: If a higher low is confirmed, a move to the range high could offer an 80% upside from current levels.
Detailed analysis
The falling wedge pattern that constrained SEI for several weeks has finally given way. With the breakout, price action not only escaped the downward sloping resistance but also managed to set a higher high, a move that confirms a potential shift in market structure from bearish to bullish.
What comes next is equally critical. For the breakout to be validated and sustained, SEI must now establish a higher low, ideally NEAR the 0.618 Fibonacci retracement, which aligns with the value area low of the current range. This area is a prime zone for support and represents a technical sweet spot where bullish momentum could resume if buyers step in.
Volume behavior will be a critical element to monitor. A rise in volume would support a bullish continuation and suggest growing confidence in the breakout. In contrast, a lack of volume may hint at a failed breakout or weak trend strength.
If SEI can hold this potential higher low, the upside opens up dramatically. The range high becomes the next logical target, offering nearly an 80% move from the current region. This would place the asset in a much more bullish context and could attract additional attention from market participants.
What to expect in the coming price action
SEI is at a technical crossroads. A successful retest and higher low at the 0.618 Fib zone would confirm a new bullish structure and open the door for a major leg up. However, failure to hold this zone could invalidate the breakout and return price to previous range lows. Keep a close eye on volume and structure development as the next few candles unfold.
