AIXBT Bulls Charge as Price Soars 20%—$0.21 Resistance in Crosshairs

AIXBT rockets past key technical levels as traders pile into the altcoin’s breakout momentum. The 20% surge marks the token’s strongest single-day gain since March, with liquidity flooding into AI-focused crypto projects.
Market Depth Shows Wall of Buy Orders: On-chain data reveals stacked limit orders up to $0.19, while shorts get liquidated above $0.20—classic fuel for a gamma squeeze.
Breaking $0.21 Could Trigger Algorithmic Avalanche: TA analysts note the resistance level coincides with the 200-day moving average. A clean break might unleash pent-up institutional demand (or at least what passes for it in this meme-driven market).
Just don’t ask about the token’s actual utility—this is crypto, where ’AI’ in the name still outperforms working products by 3x.
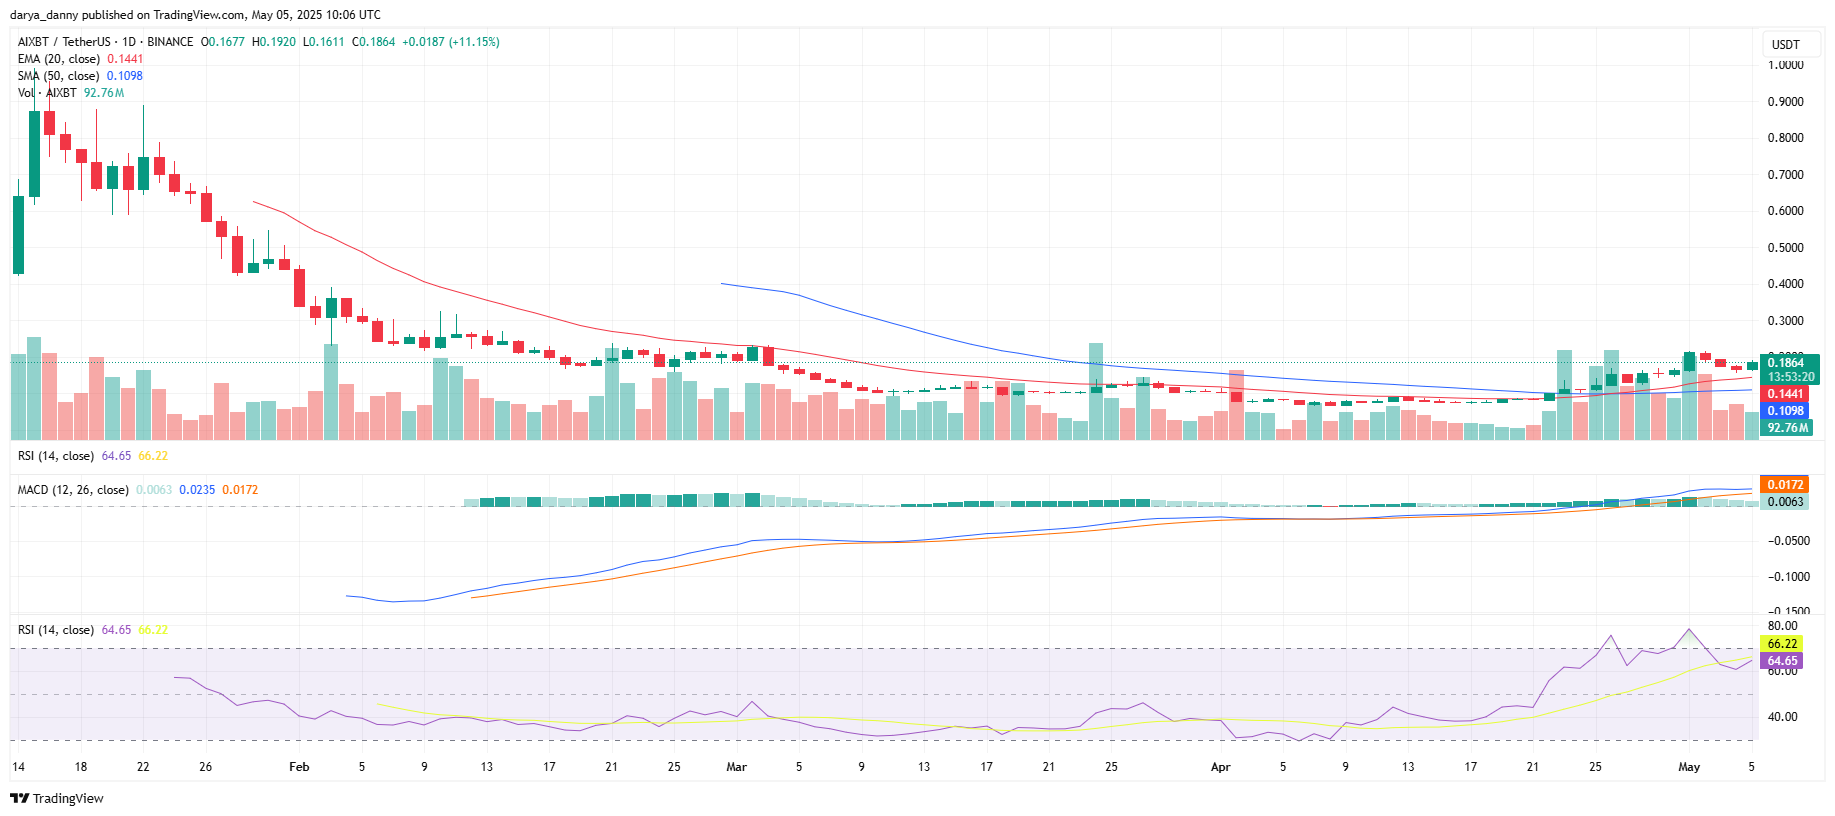 Source: TradingView
The April 23 breakout sparked a rally from $0.10 to a peak of $0.21, delivering a 110% gain. With today’s move, bulls are attempting to resume that momentum and push through the key resistance at $0.21, which remains the next critical level to watch for trend continuation. If they fail to do that, this will likely mark a consolidation under resistance, or potentially a lower high, depending on upcoming candles.
Momentum remains firmly bullish, with the RSI currently at 64, approaching the overbought zone. However, the RSI on today’s candle remains well below the peak reading of 78 seen on May 1, which helps explain the sharp pullback that occurred afterward.
The MACD line continues to trend above the signal line, and the histogram continues to print green. However, the histogram bars are shrinking, indicating that momentum is weakening, even though the trend is still intact.
The price is also trading above both the 20 EMA and 50 SMA, with the shorter-term 20 EMA crossing above the 50 SMA around April 27 — a bullish crossover that signals a potential trend reversal.
If momentum holds and price breaks above the immediate resistance at $0.21, the next target lies at $0.25 — a key psychological and horizontal resistance zone where the price consolidated for over a week in February after a sharp leg down following its all-time high in January. A further upside push could bring $0.30 into view, although that level is weaker.
