FOMC’s Next Move: Rocket Fuel for Bitcoin’s $100K Moon Mission?

As the Federal Reserve gears up for its May 2025 decision, crypto traders are placing bets—will loose monetary policy send Bitcoin screaming past six figures?
Powell’s printers vs. Satoshi’s hard cap: The ultimate liquidity showdown. When traditional finance starts playing with negative rates again (because that worked so well last time), expect capital to flood into the hardest asset humans have ever created.
Just remember: Wall Street will call it a ’risk asset’ right up until they finish accumulating their positions. Then suddenly it’ll be a ’digital gold’ narrative again.
Bitcoin price technical analysis
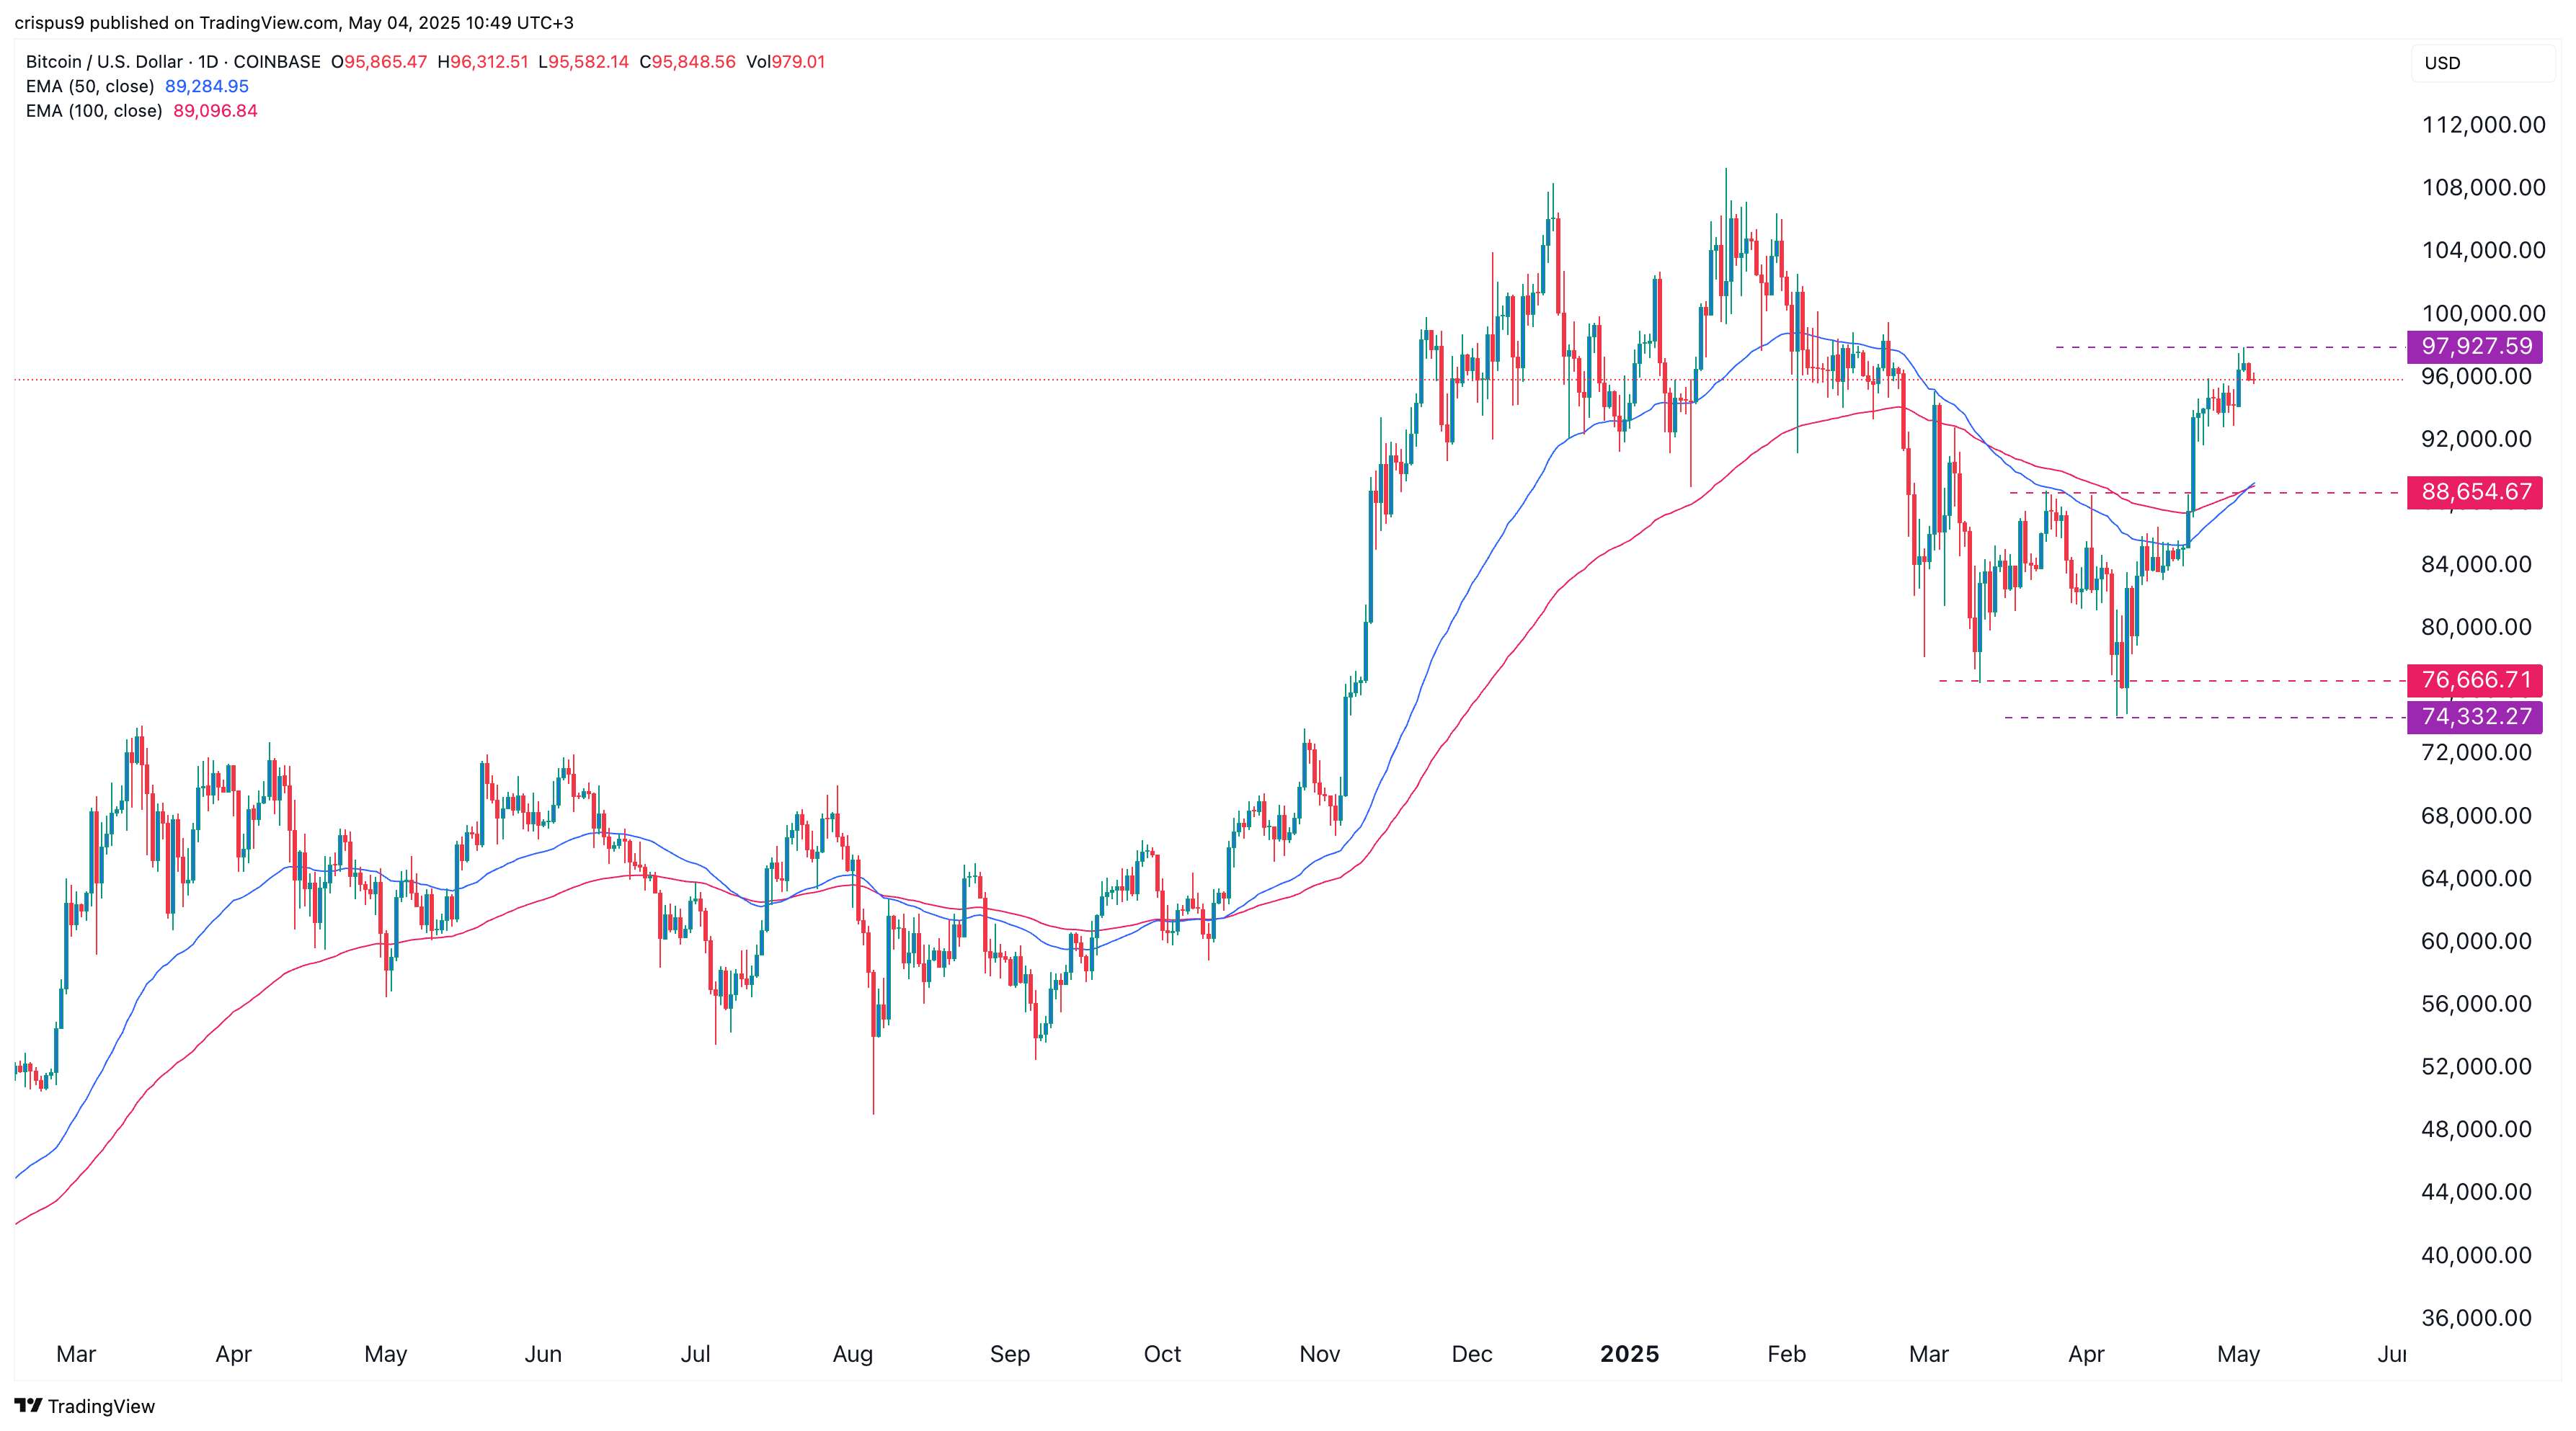
The daily chart shows that the BTC price has rallied in the past few weeks, rising from a low of $74,330 to a high of $97,927. It has crossed the important resistance level at $88,655, the neckline of the double-bottom pattern at $76,665.
Bitcoin has formed a mini golden cross pattern as the 50-day and 100-day moving averages have crossed each other. Top oscillators like the Relative Strength Index and the MACD indicators have all pointed upwards.
Therefore, the coin will likely continue rising as bulls target the resistance at $100,000. A break above that level will point to more gains, potentially to the all-time high of $109,300, in line with this BTC price prediction.
