Ethereum’s Bearish Signal Sparks Market Jitters—But Traders See Buying Opportunity

Ethereum’s price charts flash a rare warning pattern—one that’s triggered double-digit drops in past cycles. The ’death cross’ formation (when 50-day MA dips below 200-day MA) now looms over ETH, with derivatives data showing leveraged longs getting liquidated.
Yet crypto veterans aren’t panicking. ’These setups often shake out weak hands before reversals,’ says Delphi Digital’s Yan Liberman. Options markets still price 35% implied volatility, suggesting big moves either way.
Meanwhile, TradFi analysts dust off their ’I told you so’ memes—ignoring that ETH’s 90% rally since January still outperforms their precious S&P 500.
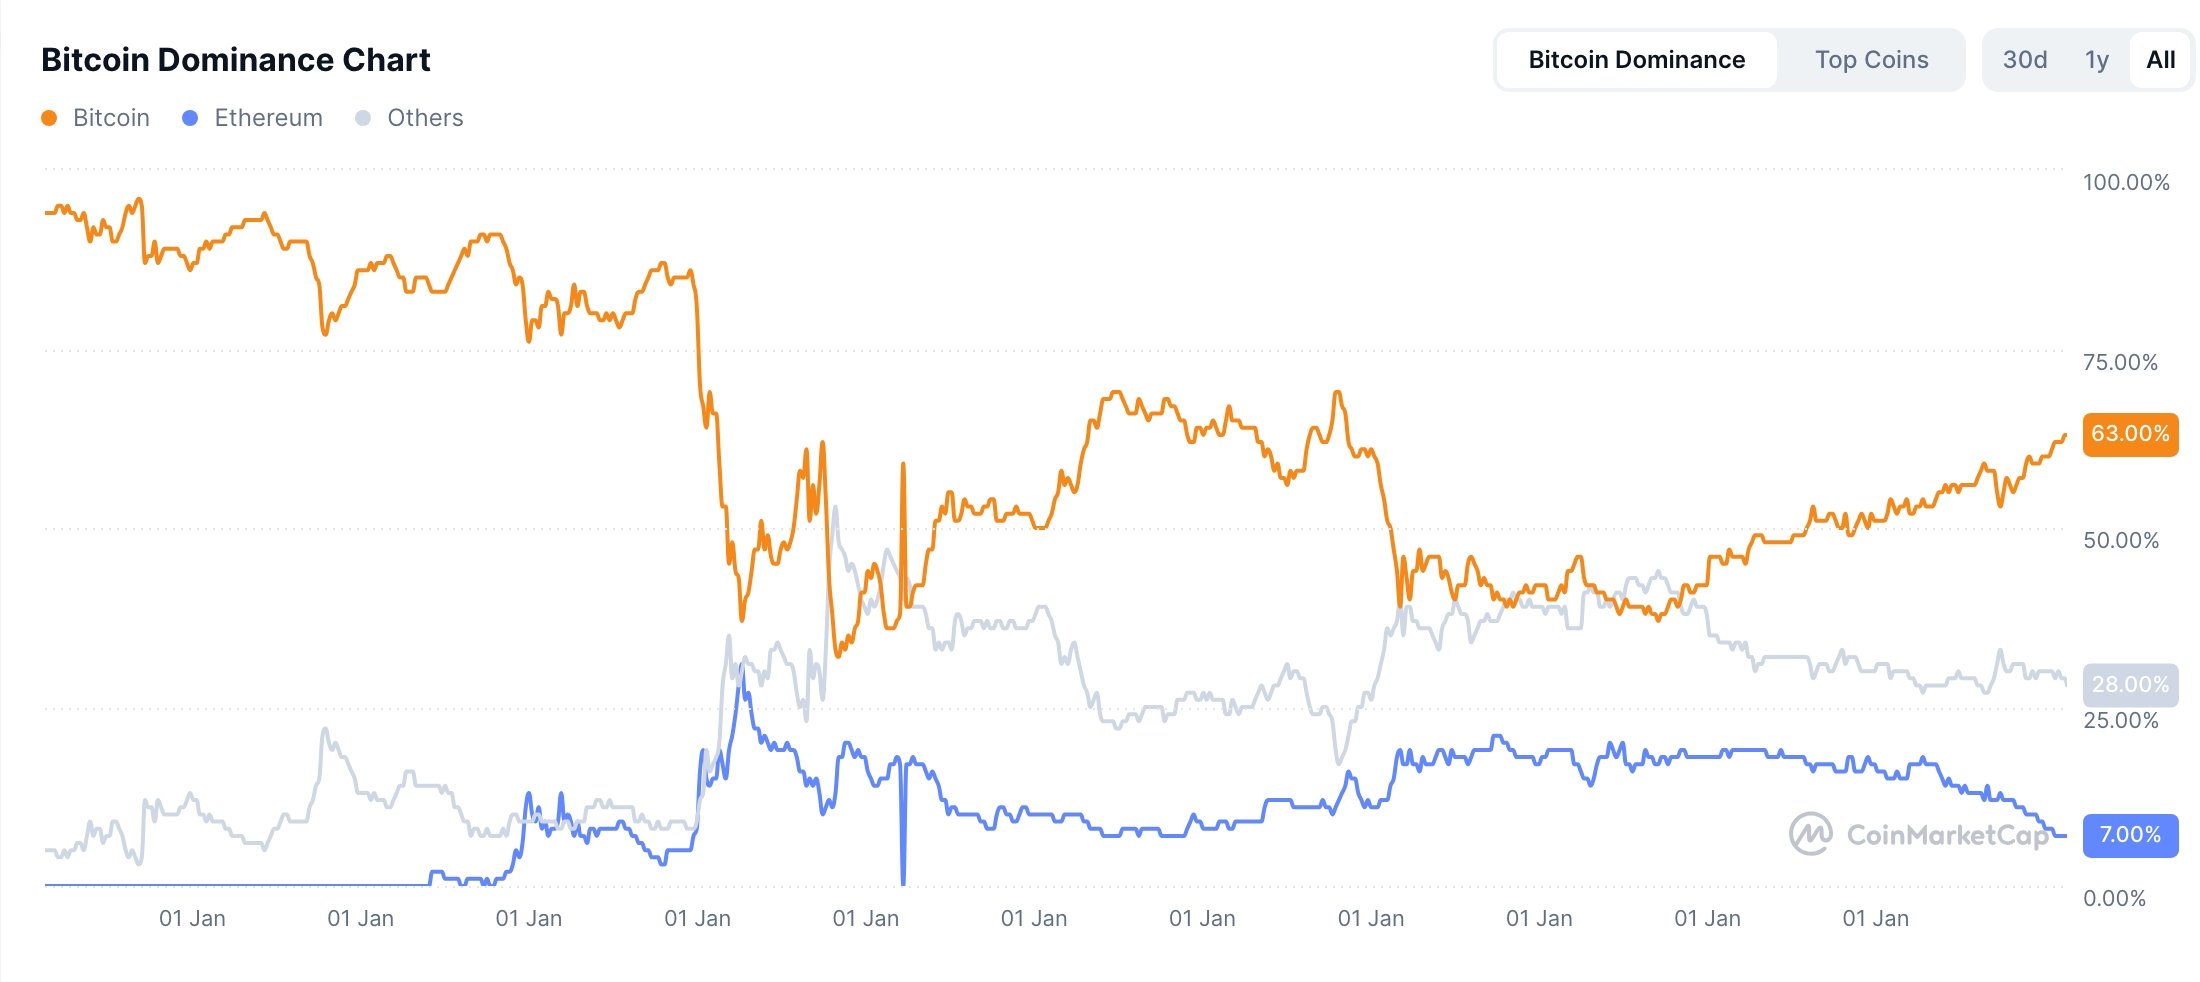 Bitcoin and Ethereum dominance diverge | Source: CoinMarketCap
Ethereum price technical analysis
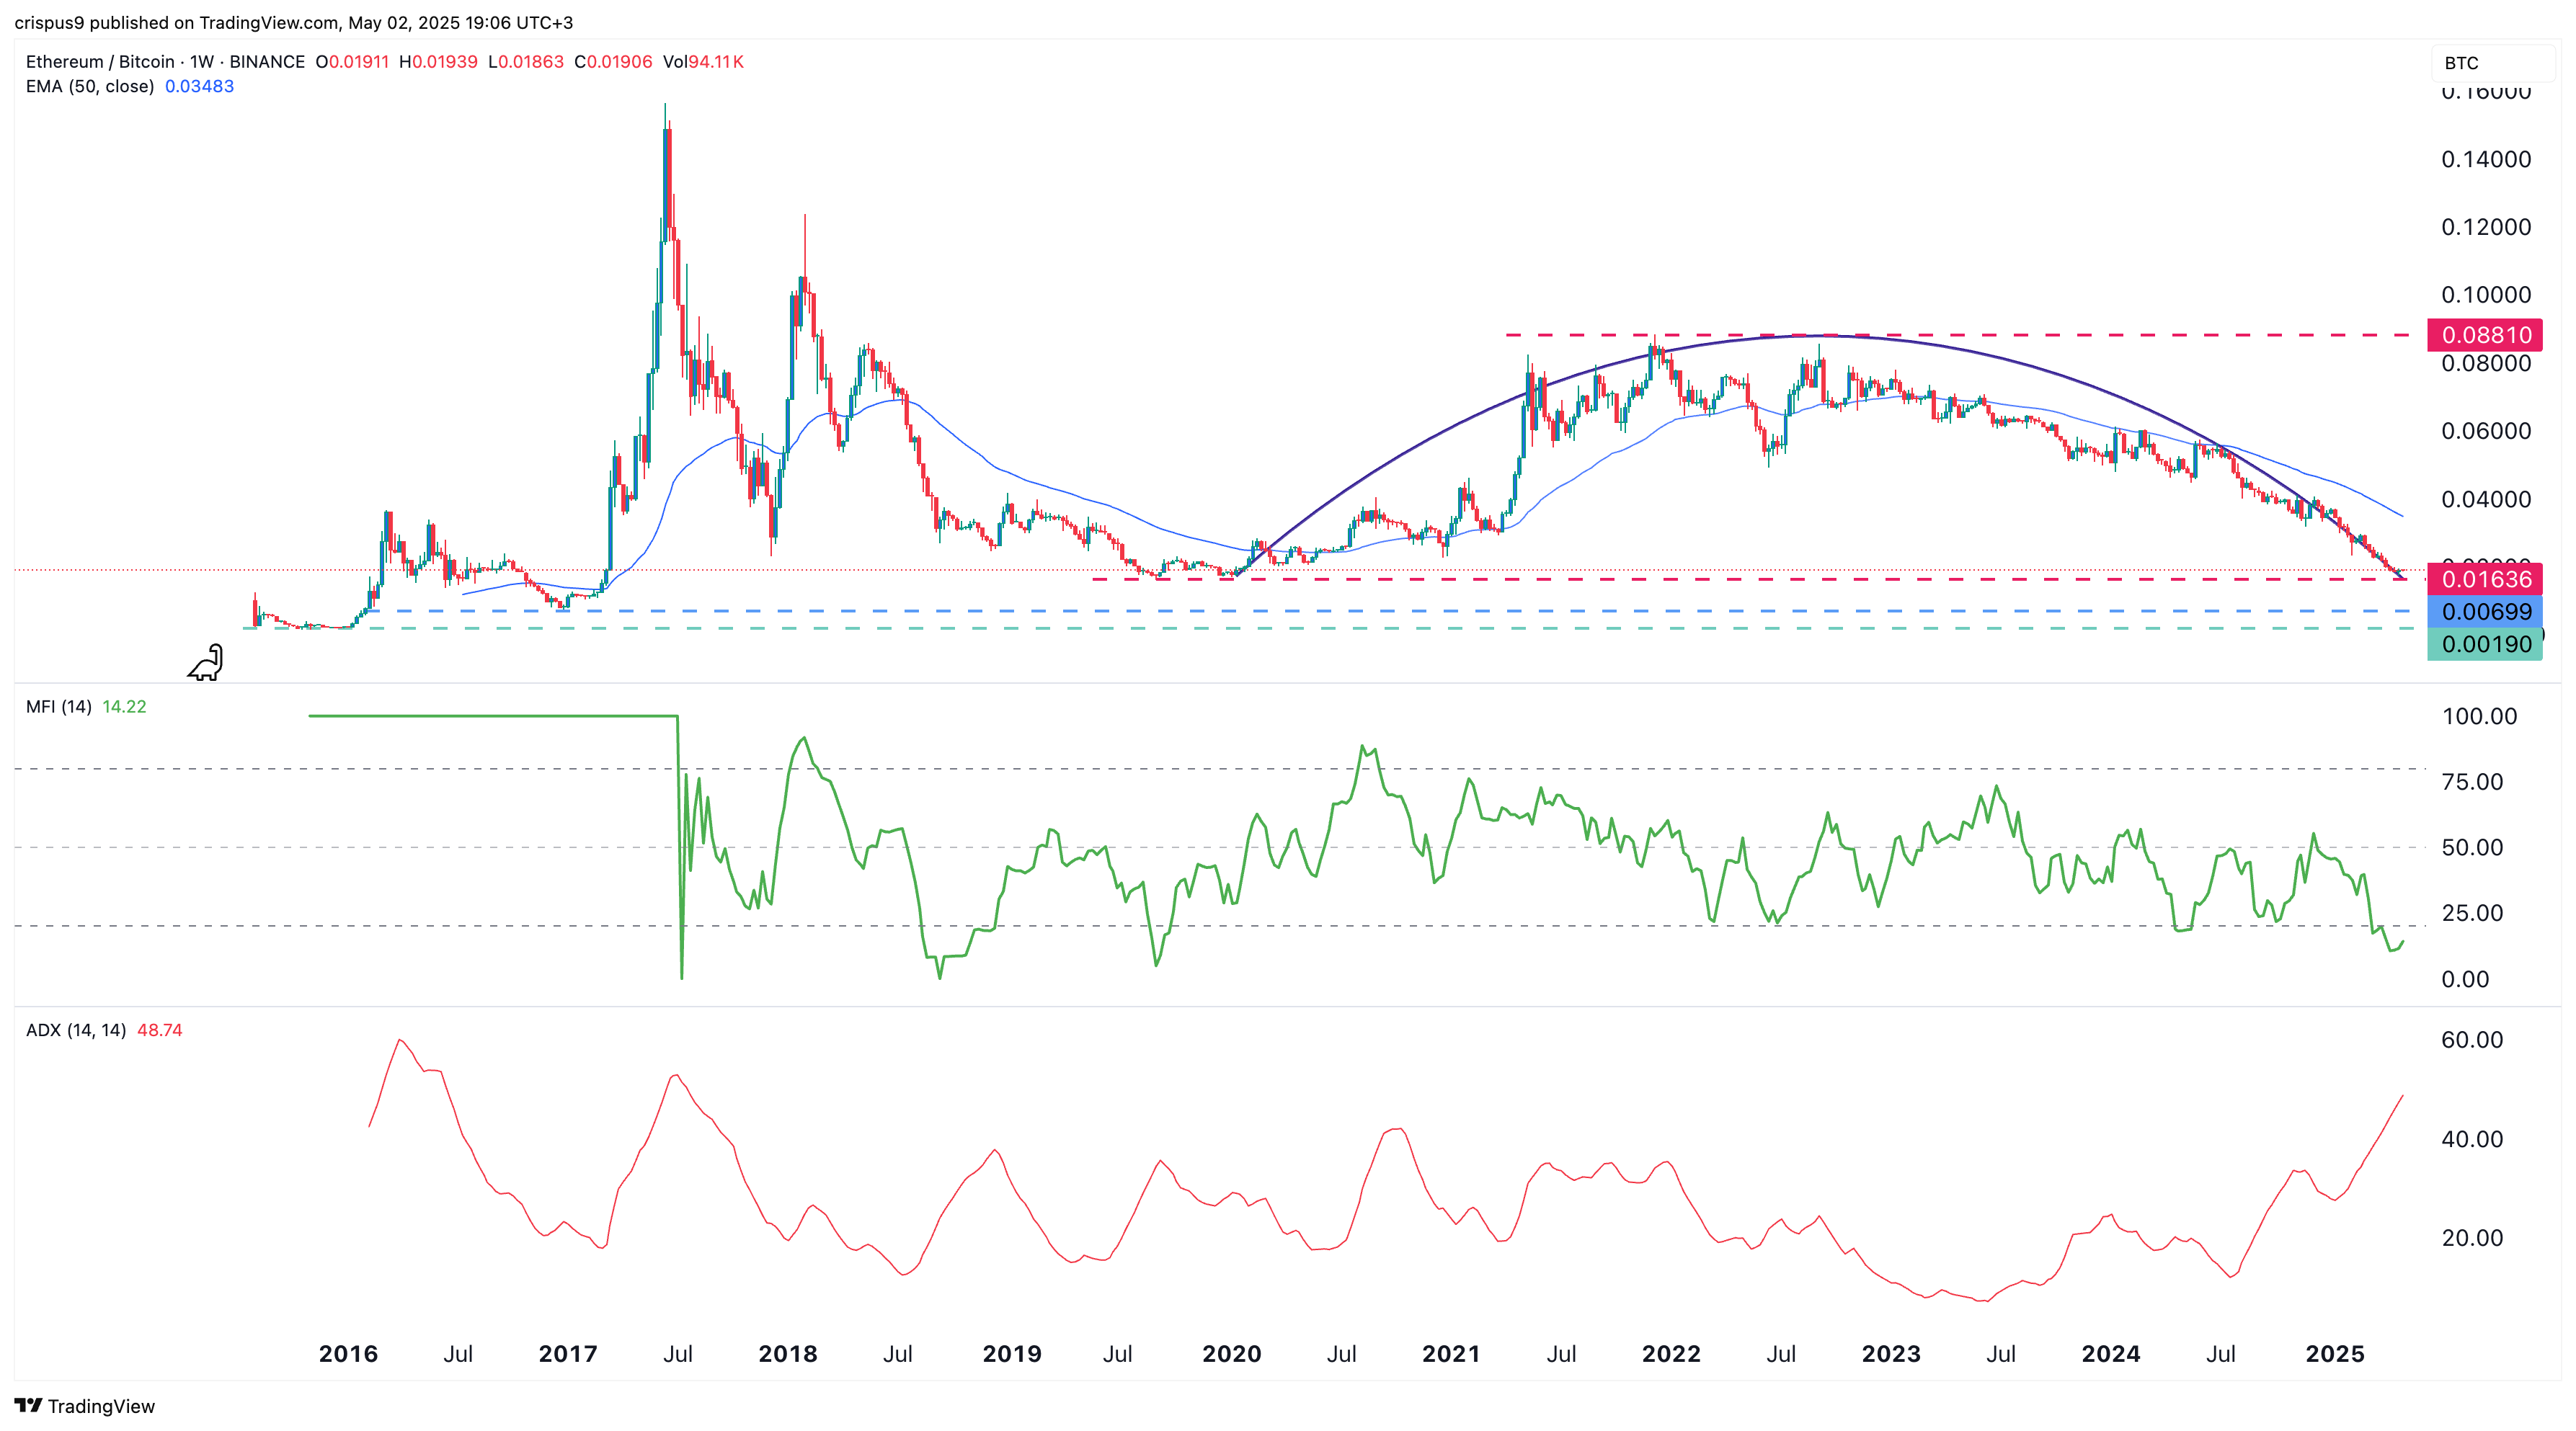
The weekly chart shows that the ETH/BTC pair peaked at 0.08810 in December 2021 and has since plunged 80% to its current 0.01890 level.
Ethereum remains below both the 50-week and 100-week moving averages. Additionally, the Money Flow Index has continued falling and now sits at an oversold level of 14.
The Average Directional Index has risen to 48.75, indicating that bearish momentum is still strong.
Crucially, the pair has formed an inverse cup and handle pattern, a well-known bearish continuation signal. This pattern features a horizontal support line and a rounded top, often preceding further downside. If the pattern plays out, the next level to watch is 0.0070, which marked the bottom in December 2016. A drop below that would set the stage for a possible retest of the all-time low at 0.0019.

Log in to Reply
Log in to comment your thoughtsComments
Related Articles
|Square
Get the BTCC app to start your crypto journey
Get started today Scan to join our 100M+ users