Fartcoin Defies Gravity With 500% Surge—But This Technical Pattern Hints at a May Meltdown

Fartcoin’s parabolic rally has traders buzzing—until they spot the ominous rising wedge forming on the charts. This classic reversal pattern suggests the meme coin’s explosive gains could turn toxic faster than a leveraged degen trade.
While retail piles in chasing the pump, savvy whales are quietly tightening stop-losses. Nothing smells worse than a overbought altcoin meeting a descending trendline—except maybe Wall Street’s sudden ’blockchain epiphany’ every bull run.
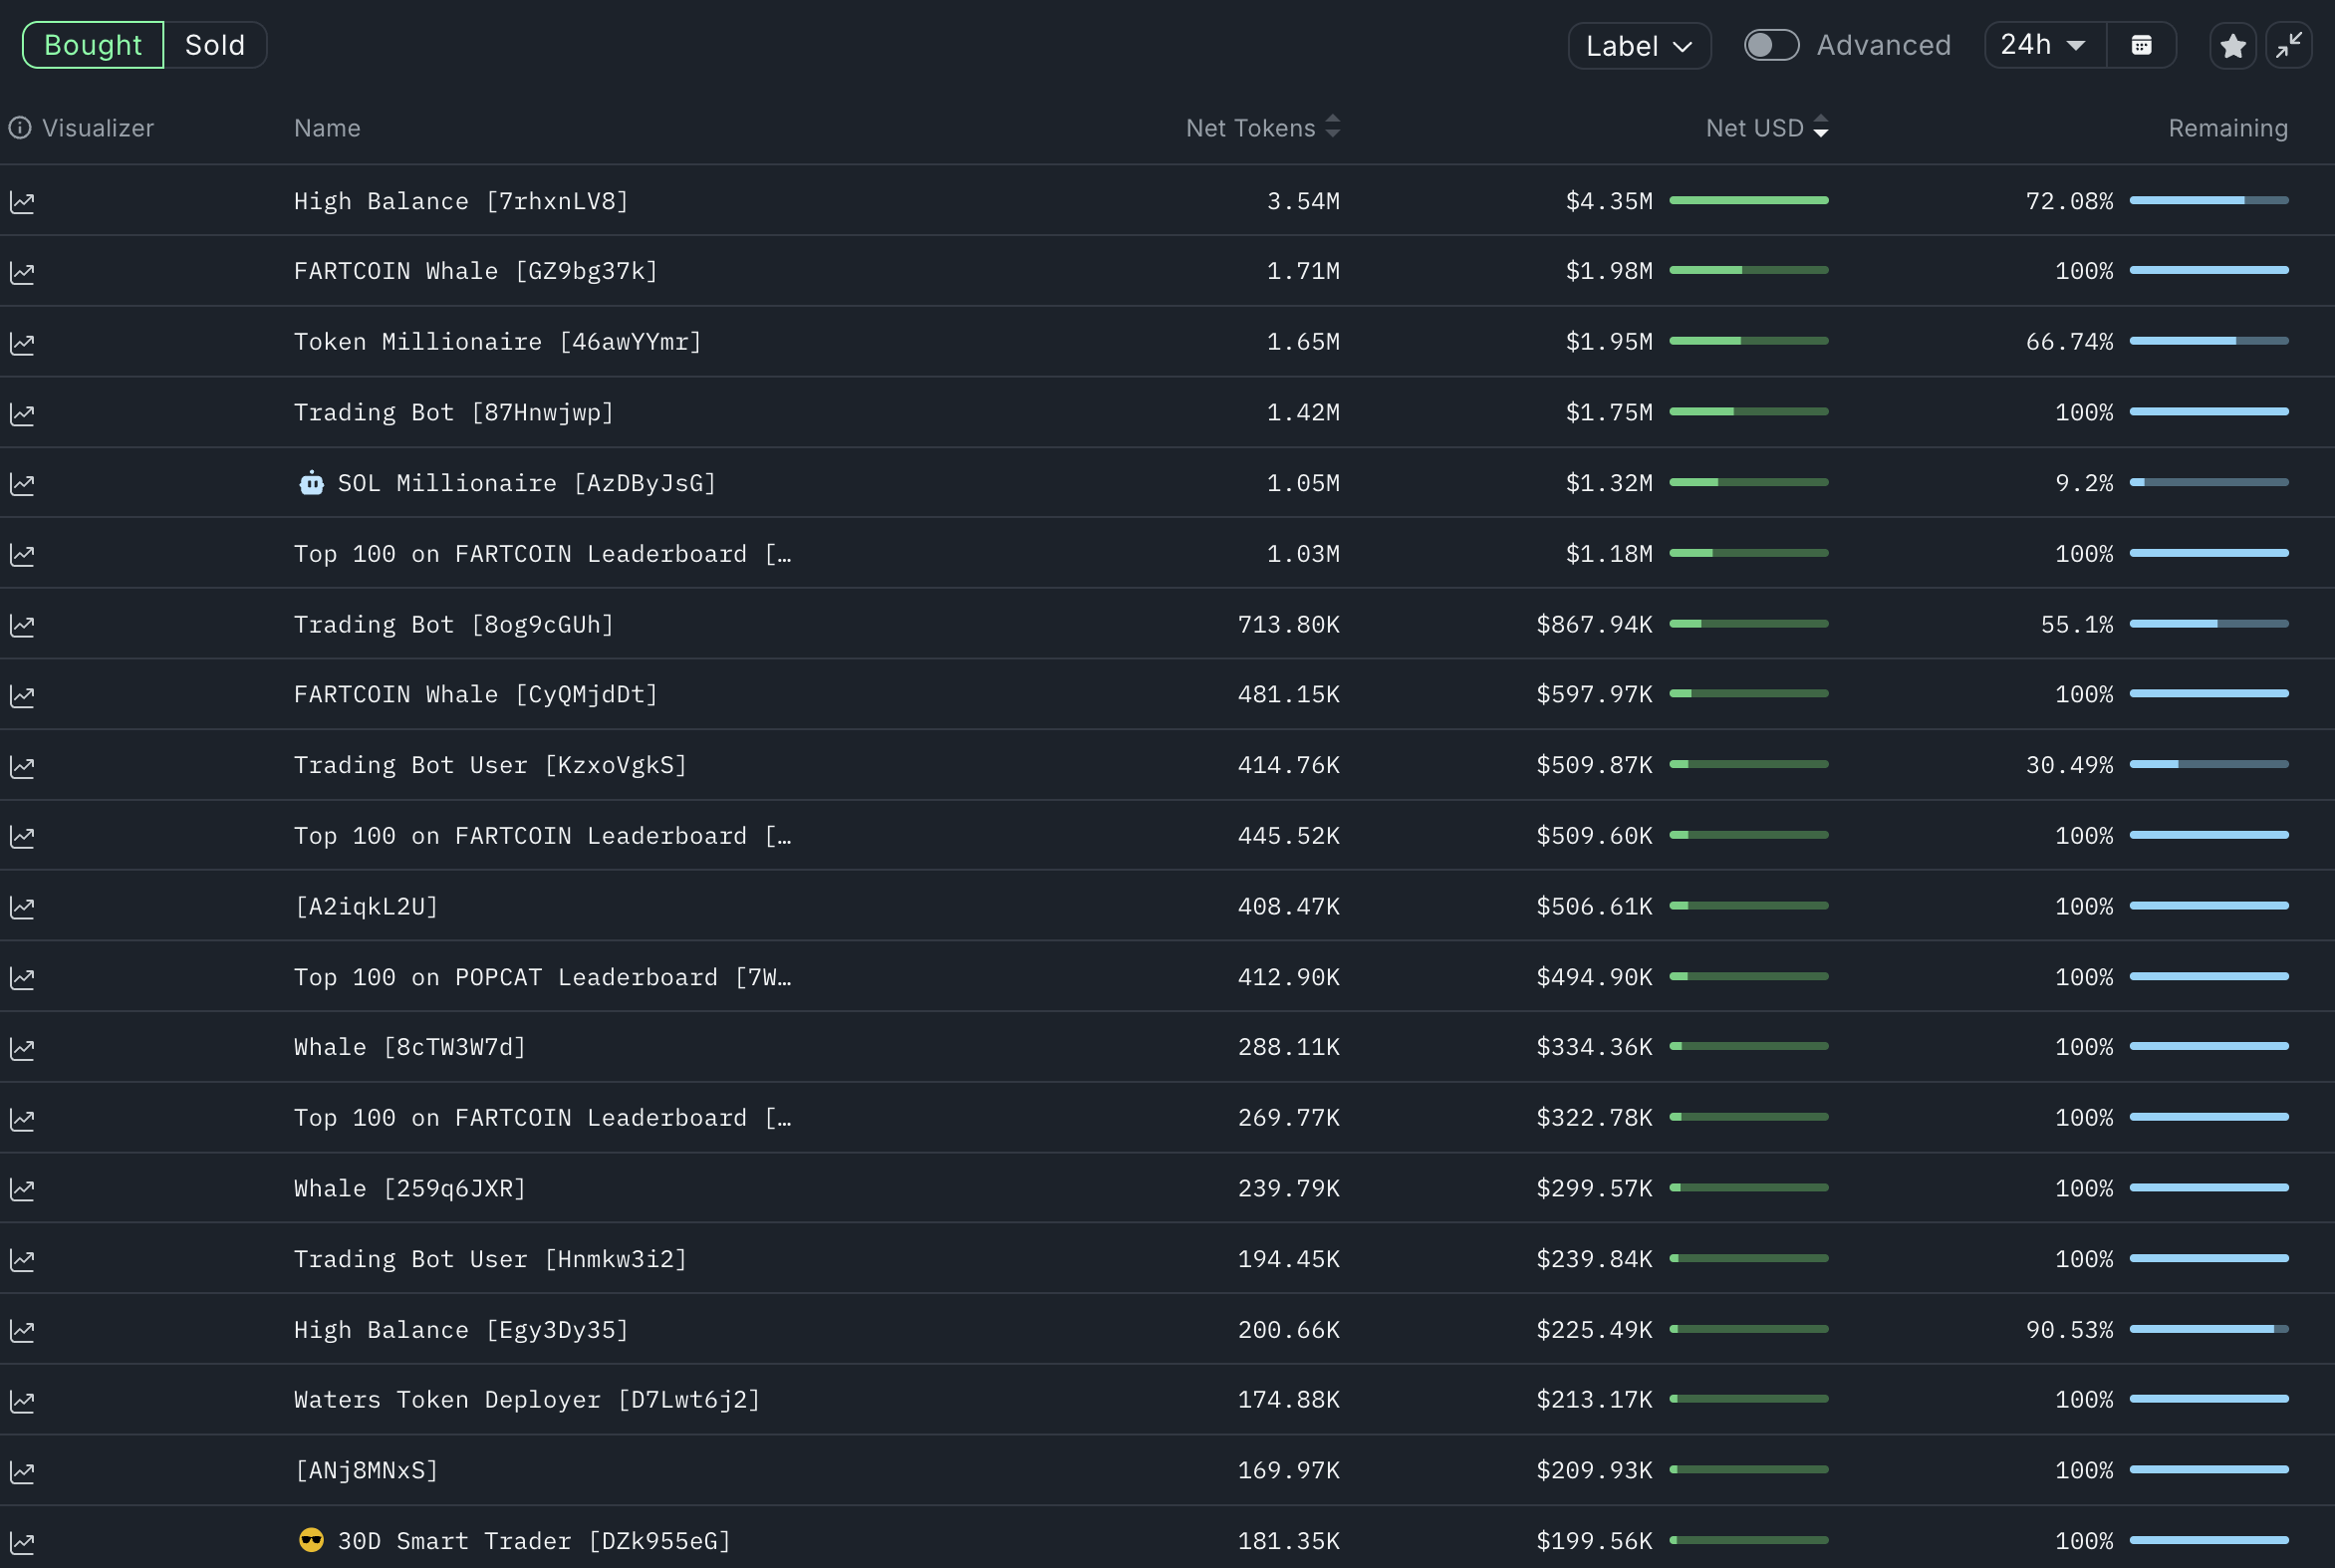 Fartcoin whale transactions | Source: Nansen
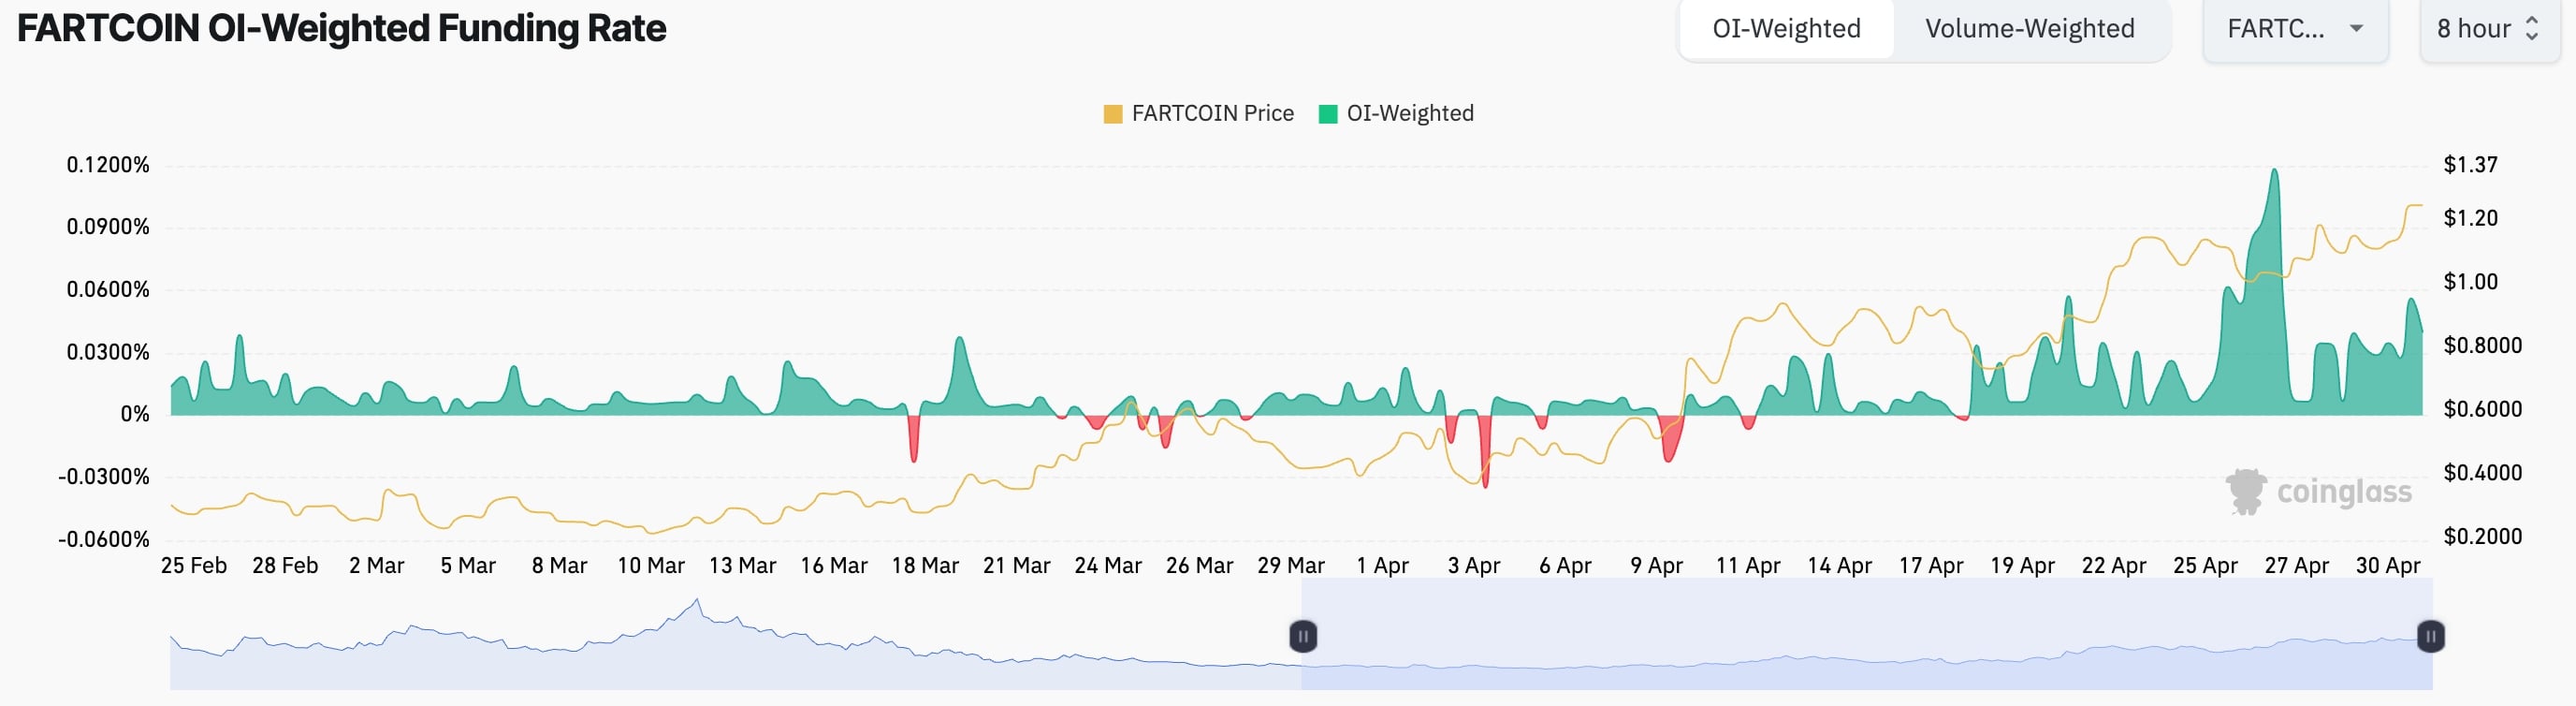
Additional data shows that Fartcoin’s surge coincided with a sharp spike in futures open interest, which ROSE to a record $612 million on Thursday, up from less than $100 million in March. This indicates growing demand and participation in the derivatives market.
Further, Fartcoin’s eight-hour funding rate has remained positive since April 18. A positive funding rate is typically bullish, as it indicates that more traders are holding long positions, driving demand for longs higher than for shorts.
Fartcoin price technical analysis
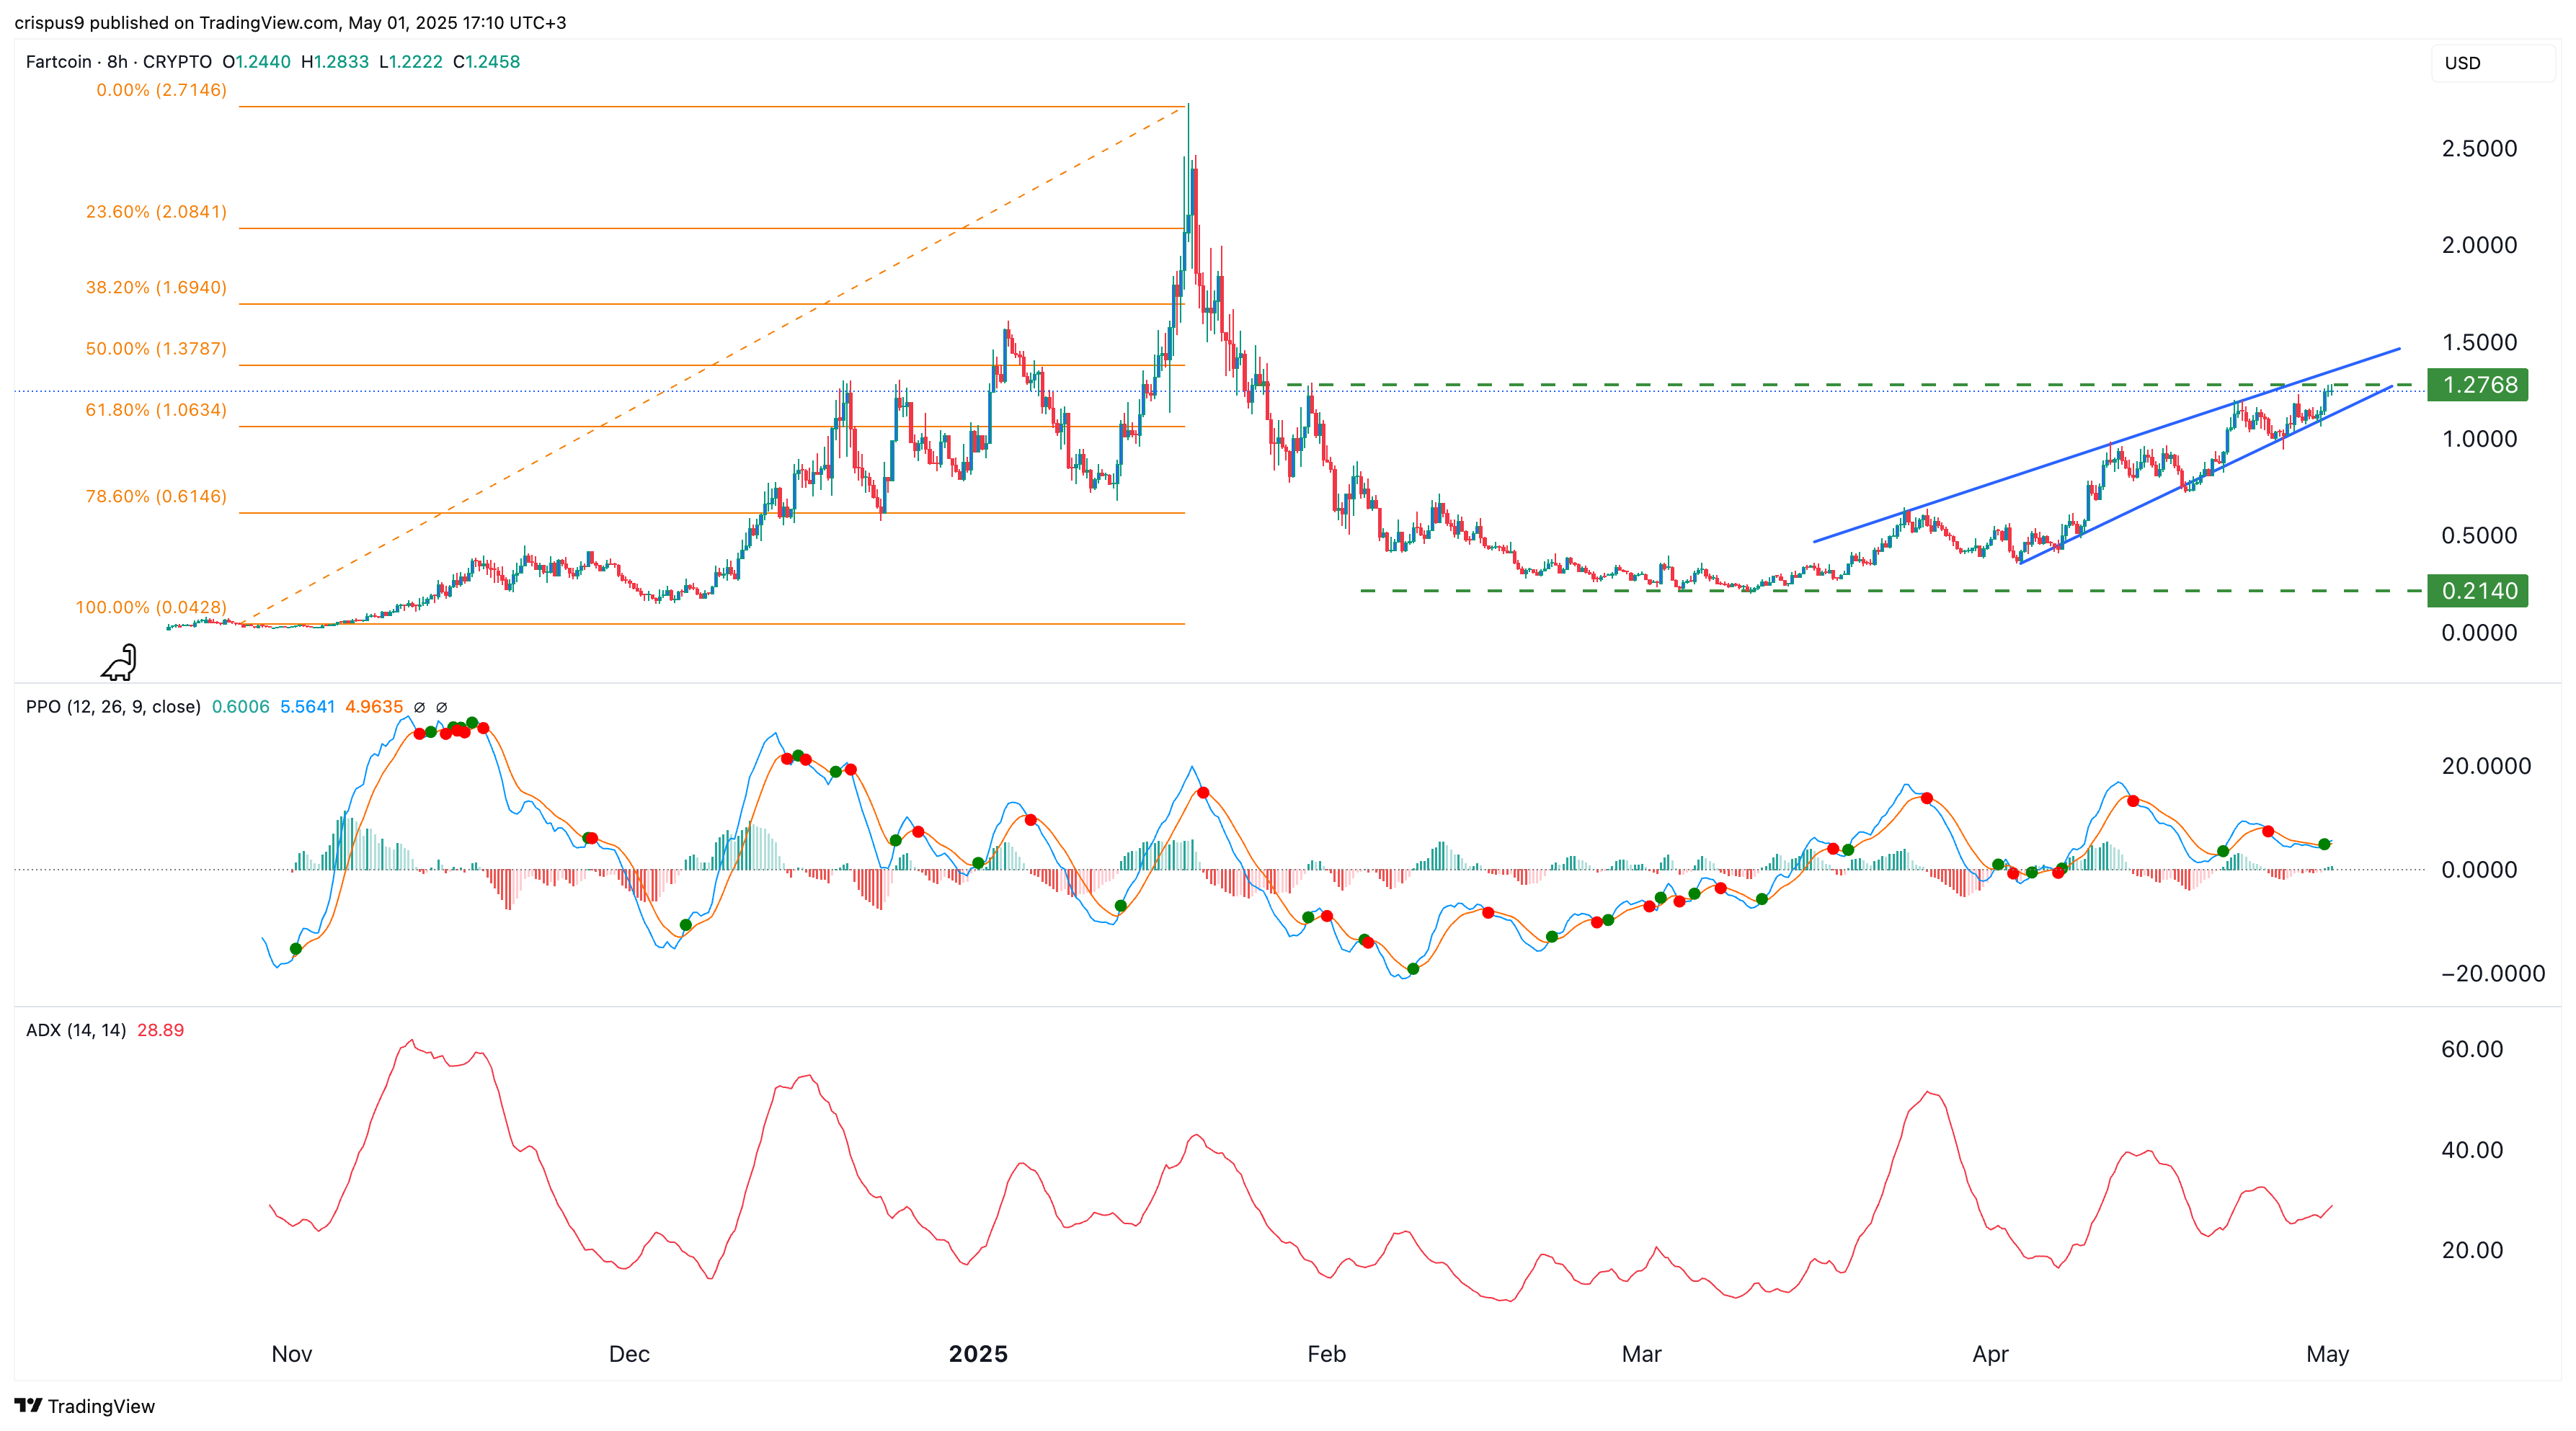
On the eight-hour chart, Fartcoin bottomed at $0.2140 in March and has since rallied to $1.2768 amid rising demand. The coin remains above the 50-period moving average, which supports a bullish outlook in the short term.
However, the chart is also signaling a potential reversal ahead. First, the coin appears to be forming a rising wedge pattern, illustrated in blue. This pattern is made up of two ascending, converging trendlines, and often precedes a breakdown once the lines converge.
Second, the Average Directional Index is moving sideways, a sign that the strength of this trend is waning. The ADX is one of the most popular indicators for measuring the strength of a trend.
Further, the Percentage Price Oscillator, a unique form of the MACD, has formed a bearish divergence pattern. Therefore, these technicals suggest that the coin may have a bearish reversal in May. If it happens, it will likely drop and retest the psychological point at $1.

Log in to Reply
Log in to comment your thoughtsComments
Related Articles
|Square
Get the BTCC app to start your crypto journey
Get started today Scan to join our 100M+ users