Bitcoin’s Price Grinds Sideways—What’s Stalling the Next Big Move?

BTC’s stuck in a boring $5K range for weeks—traders yawn while ’experts’ blame everything from ETF outflows to miner capitulation. Here’s what’s really happening.
The Liquidity Trap: Whale wallets aren’t dumping, but they’re not buying either. Institutional flows hit pause after the SEC’s latest ’crypto is a security’ theater.
Derivatives Distortion: Perpetual swaps funding rates flatlined—no leverage means no volatility. Even the usual ’halving pump’ narrative got priced in six months early (classic).
Macro Headwinds: The Fed’s ’higher for longer’ rates play sucks capital out of risky assets. Gold bugs and crypto bros unite in misery.
Until spot BTC ETFs show consistent inflows or BlackRock drops another ’unexpected’ bullish report, we’re range-bound. Pro tip: Wall Street still can’t front-run retail when the real squeeze comes—just ask the 2021 GameStop suits.
Key technical points
- Range Boundaries: $91,610 (support) and $95,700 (resistance)
- Current Structure: Lower time frame consolidation zone
- Indicators in Play: 200 MA, Point of Control (PoC), VAH/VAL levels
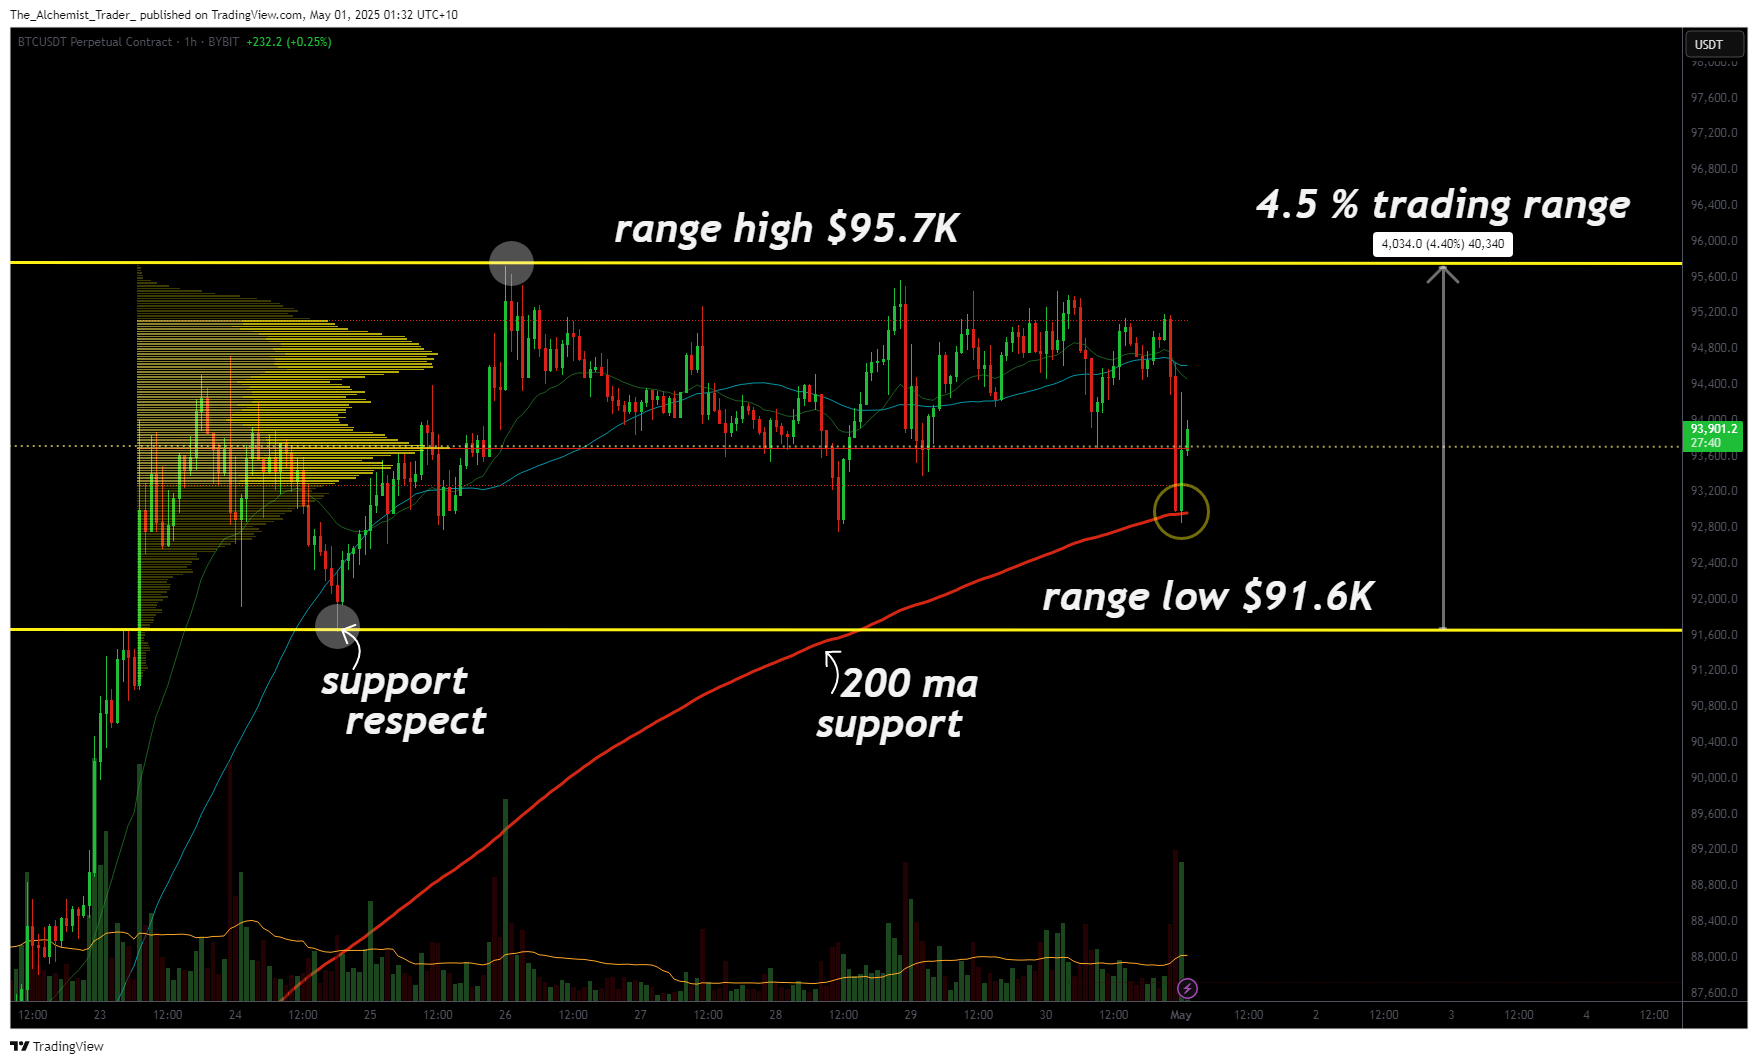
Price action has been largely dictated by key volume zones such as the Value Area High (VAH), Value Area Low (VAL), and the Point of Control (PoC). These levels mark the most traded areas within the range and have created reliable zones for short-term reactions.
Additionally, the 200-period moving average has acted as dynamic support, providing temporary relief to buyers during small dips. A loss of that level would signal weakness and likely initiate a full rotation to the range low.
Despite a few volatile moves on the intraday charts, BTC has failed to follow through with any meaningful breakout. The lack of volume accompanying these attempts confirms ongoing range-bound behavior. From a market structure perspective, the asset is still searching for equilibrium, a fair value zone that satisfies both buyers and sellers.
Why price action is moving like this
This type of chop is typical during periods of consolidation. When price is stuck between well-defined support and resistance, it reflects indecision in the market. There’s no strong fundamental driver right now pushing BTC beyond these levels, and market participants are waiting for confirmation before committing to a direction.
The moment either side of the range breaks, with volume and conviction, will determine the next trend. Until then, we remain in balance, with price action constrained by these local highs and lows.
What to expect in the coming price action
Traders should be on alert for a clean break of either boundary. A breakout above $95,700 backed by strong volume would be a bullish signal, while a loss of $91,610 could trigger a bearish move. Until that happens, Bitcoin is likely to continue oscillating within this well-defined lower time frame channel as it seeks its next trend.

Log in to Reply
Log in to comment your thoughtsComments
Related Articles
|Square
Get the BTCC app to start your crypto journey
Get started today Scan to join our 100M+ users