Bitcoin’s $482 Billion Stress Test: When ’Digital Gold’ Becomes the Collateral of Last Resort

Wall Street’s favorite hedge against chaos faces its ultimate liquidity trial—just as traditional markets start sweating their over-leveraged balance sheets. The ’flight to quality’ narrative gets messy when the quality in question still swings 10% before breakfast.
Forget Fed pivots or ETF flows. This is about what happens when institutional players start treating BTC like a T-bill substitute during a liquidity crunch. Spoiler: the volatility will be spectacular.
Bonus jab: Nothing unites bankers and crypto degens like using other people’s money to gamble on unproven store-of-value theories.
Bitcoin price technical analysis
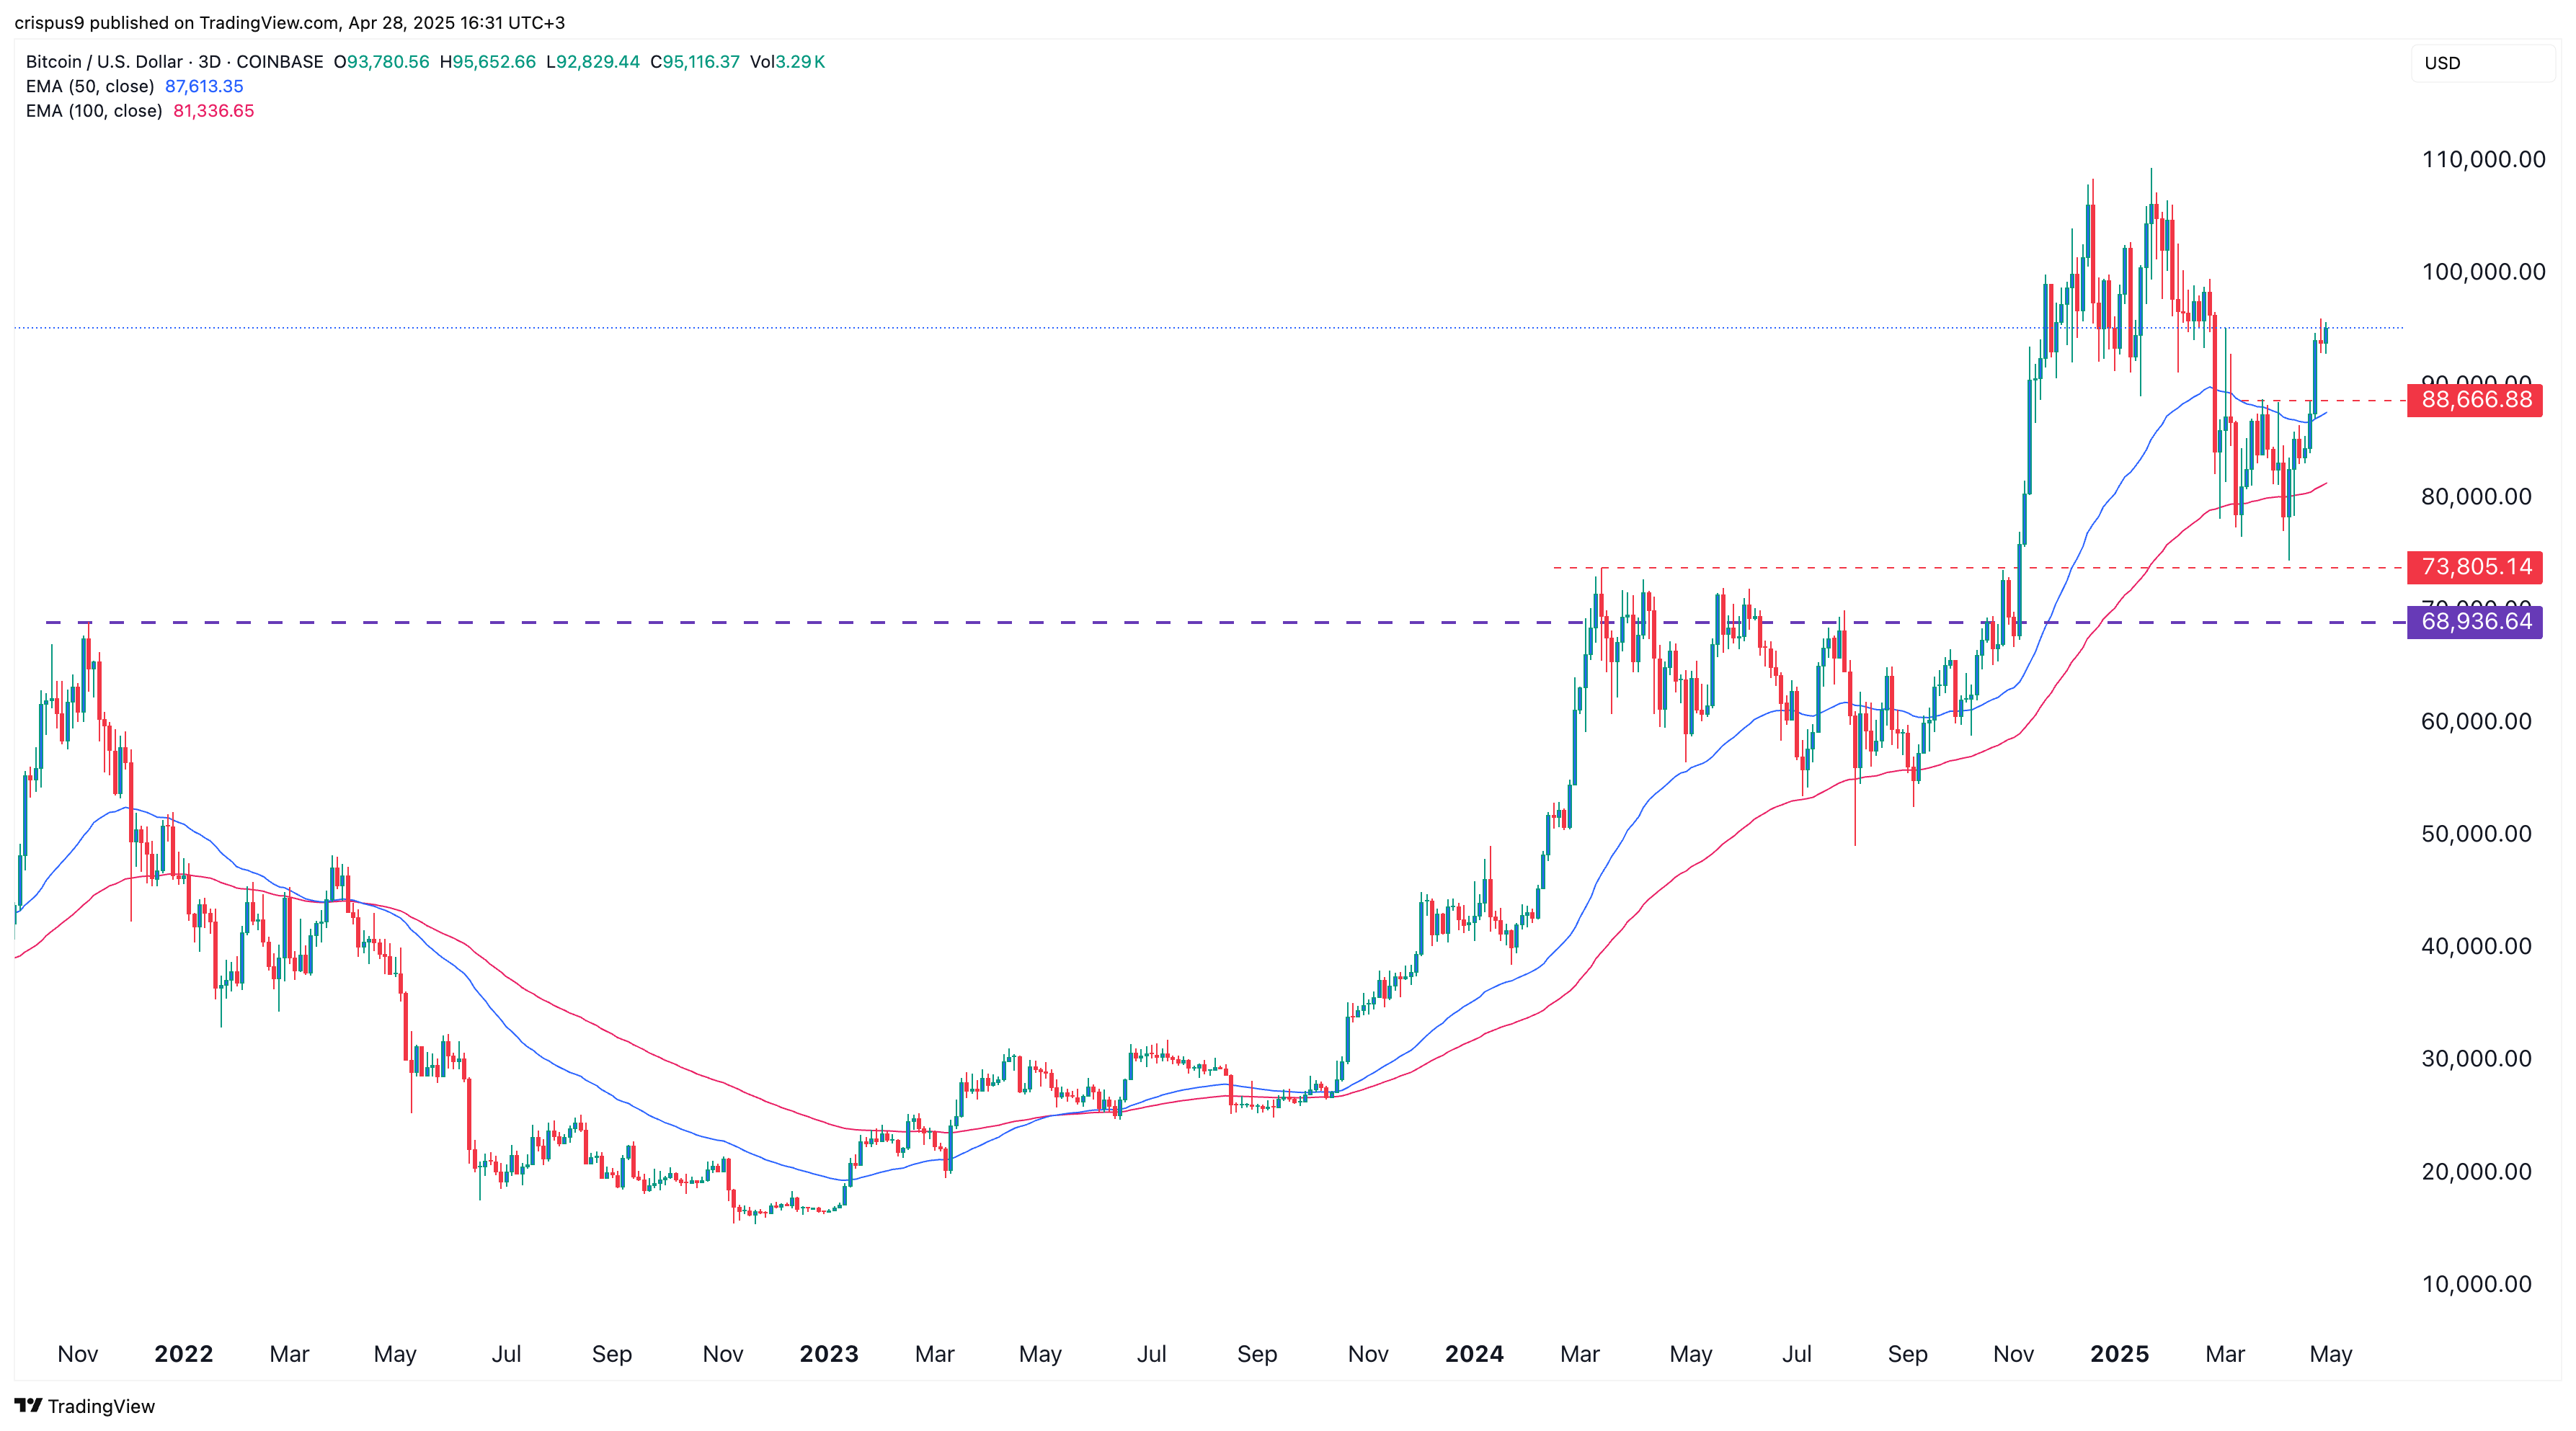
The 3-day chart shows that the BTC price has bounced back over the past few days. It recently crossed the crucial resistance level at $88,666, the neckline of the double-bottom pattern that formed earlier this month.
Bitcoin remains above the key resistance at $73,805, which marks the upper side of the cup and handle pattern. It has also moved above the 50-day and 100-day Exponential Moving Averages, signaling that bulls remain in control.
Therefore, the most likely scenario is for the coin to rise toward the important resistance at $100,000. After that, Bitcoin could soar to its all-time high of $109,300, followed by the cup and handle target of $122,000.

Log in to Reply
Log in to comment your thoughtsComments
Related Articles
|Square
Get the BTCC app to start your crypto journey
Get started today Scan to join our 100M+ users