BNB Shatters Critical Support - Is $1,000 The Next Stop In This Crypto Carnage?

BNB just ripped through major support levels like tissue paper - and the charts are screaming bearish.
The Breakdown Details
That key support zone everyone was watching? Gone. Evaporated faster than a meme coin's utility. Now traders are staring down the barrel at potential $1,000 levels - a psychological threshold that could trigger even more panic selling.
Market Mechanics At Play
This isn't just technical analysis mumbo-jumbo. Real money is moving, leverage is getting liquidated, and the order books are thinning out. When major supports break, they often become resistance on any bounce attempts - classic market psychology in action.
Broader Crypto Context
BNB's struggle comes amid broader crypto weakness, because apparently even exchange tokens aren't immune when the tide goes out. Though let's be real - in crypto, 'fundamentals' often just means 'whatever narrative pumps my bags.'
Where From Here?
Either this is the buying opportunity of the decade or the start of a much deeper correction. But with volatility this high, one thing's certain: the only people making guaranteed money right now are the exchange collecting fees on all these panic trades.
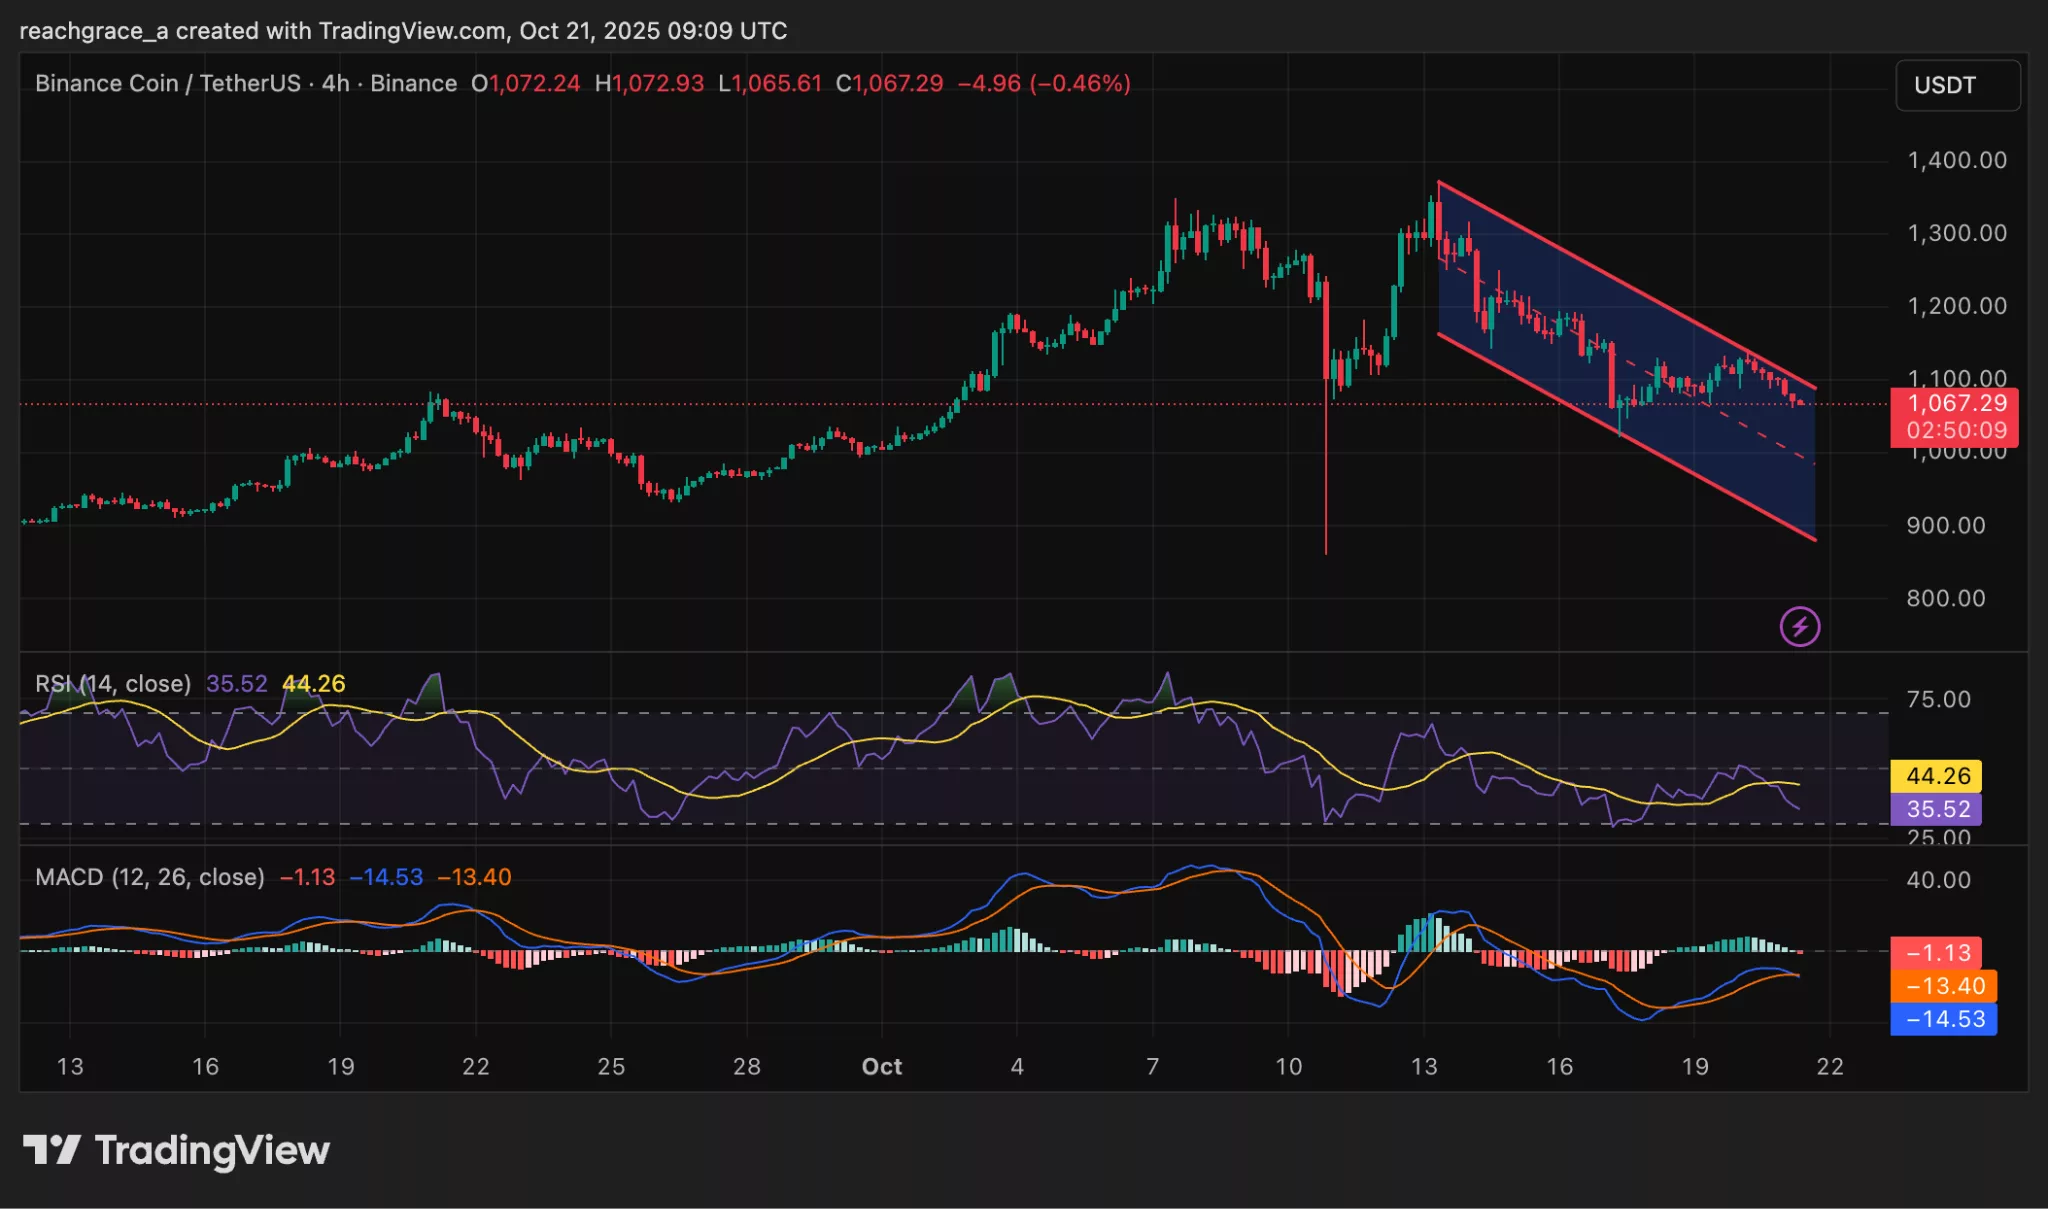 BNB price chart | Source: TradingView
Price action opened the week above $1,200, but quickly succumbed to selling pressure, dragging the token closer to the $1,050 support zone by October 21. The recent drop below $1,100 has now brought BNB closer to the channel’s lower boundary, which currently aligns around the $1,050–$1,030 zone.
This area is acting as the last visible support before the psychological $1,000 mark, a level that could become a key battleground between buyers and sellers.
BNB price eyes $1,000 correction as technical indicators support downtrend
From a momentum standpoint, the chart shows the token’s Relative Strength Index (RSI) has declined to 35.60, moving further below its 14-day moving average at 44.26. The widening gap confirms that sellers are in control, with momentum skewed to the downside. The RSI remains below the neutral 50 level, and unless it flattens or reverses, it supports further weakening in the short term.
The MACD indicator reinforces this bearish outlook. The MACD line at –14.50 sits just below the signal line at –13.39, with the histogram still negative at –1.11, suggesting mild but sustained bearish momentum.
With $1,100 now broken, the next support levels lie at $1,020 and $1,000. A decisive MOVE below $1,000 could expose $960, an area that attracted strong buying interest earlier in October. On the upside, bulls need to reclaim $1,100 and close above it to negate the bearish structure, with resistance ahead at $1,150 and $1,200.
