Chainlink (LINK) Price Primed for 35% Surge as Crypto Whales Gobble Up Supply Near Critical Resistance

Whales are circling Chainlink—and they're hungry. Massive accumulation patterns near key technical levels suggest LINK could be gearing up for a major breakout.
The Whale Feeding Frenzy
While retail investors chase memecoins, smart money is building positions in actual utility tokens. LINK's recent consolidation near resistance levels has become a buffet for deep-pocketed traders betting big on the oracle network's fundamentals.
Technical Setup Screams Opportunity
That 35% upside target isn't just hopium—it's backed by textbook chart patterns and whale activity that typically precedes significant moves. Resistance levels that once looked imposing are now showing cracks as institutional money piles in.
Oracle Networks: The Unsexy Workhorses
While everyone's distracted by the latest dog-themed token, Chainlink continues doing the actual work that makes DeFi function. Real-world asset tokenization, cross-chain interoperability—the boring stuff that actually moves markets long-term.
Of course, in crypto land, even the most solid fundamentals can get wrecked by a single Elon Musk tweet—but for now, the whales are voting with their wallets. And they're betting heavily that LINK breaks through.
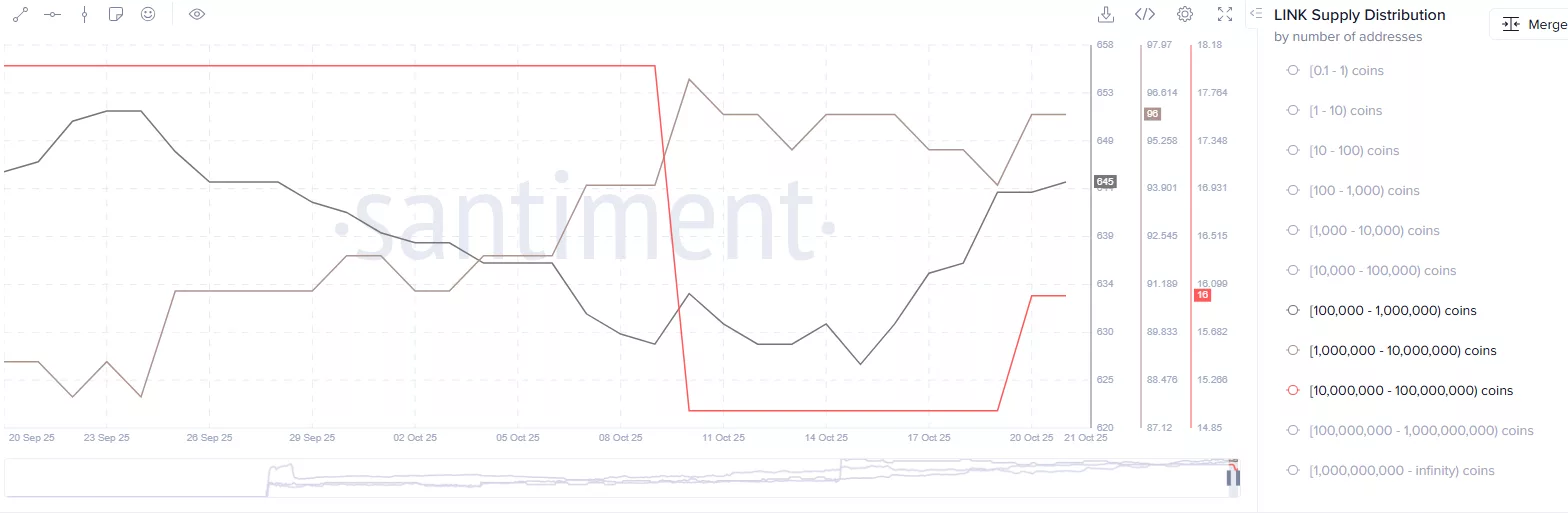 Source: Santiment
Specifically, the balance of LINK held across centralized exchanges dropped by 3.8% over the past week, bringing the total down to 269.6 million tokens, a sign that investors may be moving their assets into self-custody, typically seen as a bullish signal.
Chainlink price analysisOn the daily chart, chainlink price appears to have formed a double bottom pattern, a structure often viewed as a bullish reversal, signaling that the recent selling pressure may be easing as buyers step in to defend a key support zone.
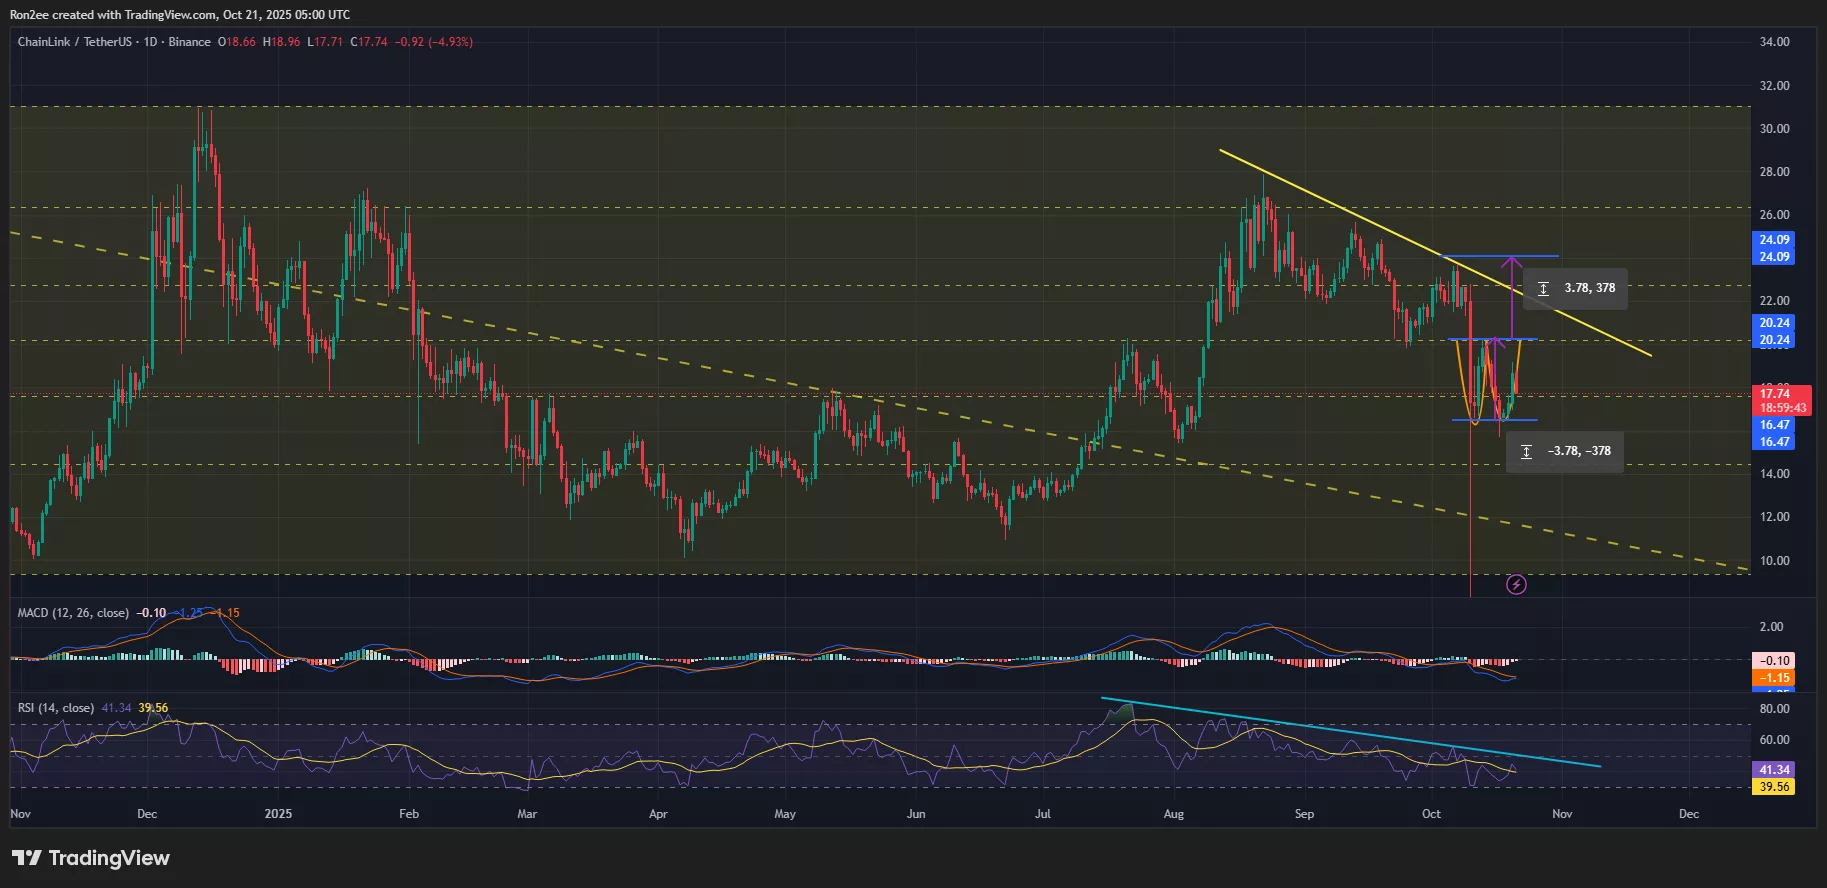
The immediate resistance to watch lies near $20.24, which marks the neckline of this potential reversal formation. Interestingly, this level also lines up with the 50% Fibonacci retracement zone, adding more weight to its importance.
If LINK manages to break above this neckline while the RSI also pushes through its descending trendline resistance, it WOULD likely add strong confirmation to the bullish setup. As of press time, the MACD lines were trending upward, suggesting that momentum is gradually shifting in favor of the bulls.
A confirmed breakout from this double bottom pattern could open the doors for a rally toward $24, which is derived by projecting the depth of the pattern above the neckline level. The target lies 35% above the current price level.
However, if LINK fails to hold above support and drops below $16.47, a level that corresponds with the 38.2 percent Fibonacci retracement, the bullish structure would be invalidated, possibly exposing the token to further downside risk.
Disclosure: This article does not represent investment advice. The content and materials featured on this page are for educational purposes only.
