Bitcoin Targets $115K Breakout as Spot BTC ETFs Rake in $429M Net Inflows

Bitcoin's relentless surge continues as institutional money floods the market.
Record ETF Inflows Signal Institutional Confidence
Spot Bitcoin ETFs just pulled in a massive $429 million net inflow—proving Wall Street finally understands what crypto natives knew years ago. The traditional finance crowd appears to be chasing momentum rather than leading it.
Technical Breakout Imminent
With this institutional fuel, Bitcoin eyes the $115,000 resistance level. The charts show all the classic signs of a major breakout pattern forming. When institutions finally show up to the party, they tend to bring the good champagne.
Market Dynamics Shift
The ETF inflows create a supply squeeze that could accelerate price appreciation. Meanwhile, traditional bankers still can't decide if crypto is a threat or an opportunity—typical hedge fund indecision.
This isn't just another rally—it's the validation of Bitcoin's role in the future of finance. Whether traditional investors like it or not, the digital gold narrative just got a $429 million stamp of approval.
BTC spot ETF inflows strengthen “Uptober” outlook
ETF flows continue to drive Optimism as October begins. Data from SoSoValue shows U.S. spot Bitcoin ETFs brought in $429.9 million in net inflows on Sept. 30, marking a second straight day of gains.
BlackRock’s IBIT led the way with $199.4 million, followed by Ark Invest’s ARKB at $105.7 million and Fidelity’s FBTC with $54.7 million. No ETF reported outflows, pushing total monthly inflows to $3.53 billion. Analysts suggest this trend could extend into Q4.
Over the past year, Bitcoin’s market capitalization has increased from $870 billion to $1.07 trillion, with average daily inflows of $385 million, according to Carmelo Alemán, a contributor to CryptoQuant. Large wallet accumulation and cautious miner selling indicate a structurally bullish market, and record-high global liquidity may help BTC’s rise even more.
Alemán argued that these factors set the stage for a new all-time high, with an ambitious projection of $180,000 within Q4.
Bitcoin price technical analysis
Bitcoin is consolidating just below the $115,000 resistance level. Bollinger Bands indicate that volatility is likely to increase as the price leans toward the upper band. While the stochastic reading of 61 suggests the market is not yet overheated, the relative strength index is at 54, indicating neutral momentum.
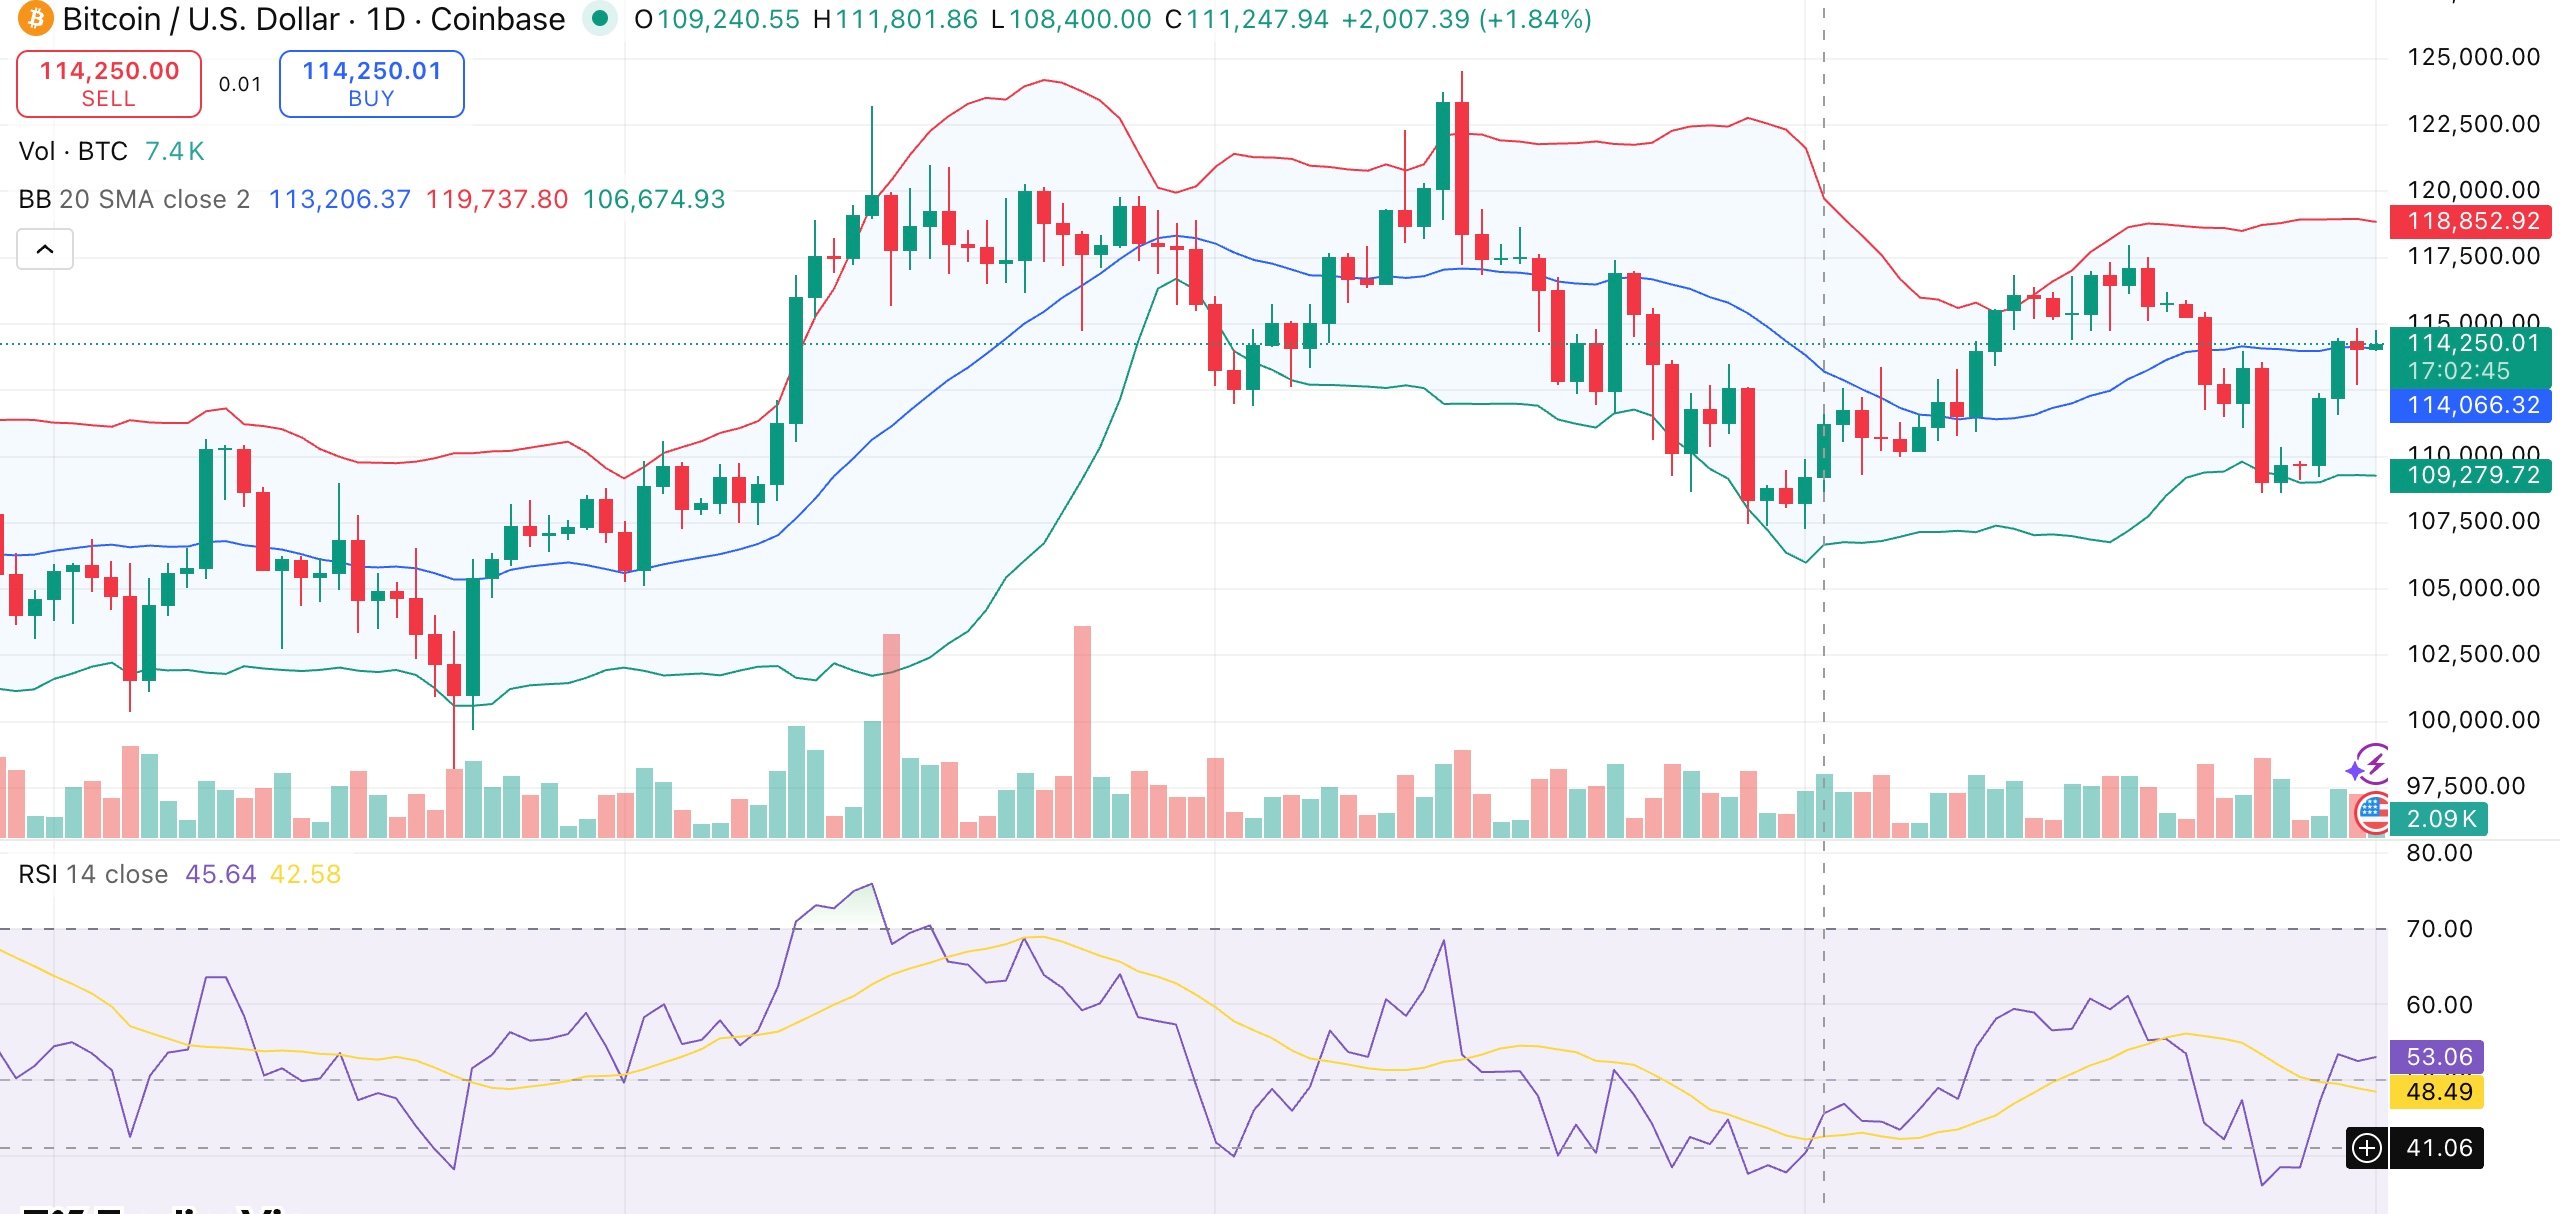
The bullish case is supported majority of moving averages. The 200-day simple moving average at $104,920 offers a solid floor, and both the short- and long-term averages are still in buy territory. A strong breakout above $115,000 could open the door to August’s high, which is close to $124,000. Immediate support lies around $113,000.
In a bullish scenario, if institutional accumulation and ETF demand persist, Bitcoin could rise to new highs. Although the overall structure is still supportive, a bearish turn would probably result in a retest of $110,000.
