HBAR Primed for Major Reversal Despite Current Pullback - Technicals Signal Explosive Move

HBAR's current dip masks brewing technical storm. Charts flashing reversal patterns that could catch bears off guard.
Technical Breakdown
Multiple timeframe analysis reveals converging bullish signals. Key indicators positioning for potential breakout that defies current market sentiment. The setup mirrors historical reversal patterns that preceded major rallies.
Market Psychology vs Technical Reality
Traders chasing short-term moves might miss the bigger picture building beneath the surface. Classic case of Wall Street overthinking what the charts clearly signal - but what do algorithms know about actual price discovery anyway?
Positioning for the Turnaround
Current levels offering potential entry points before technical confirmation triggers broader market attention. The reversal setup suggests this pullback could become distant memory faster than a hedge fund blaming 'unforeseen market conditions' for their terrible trades.
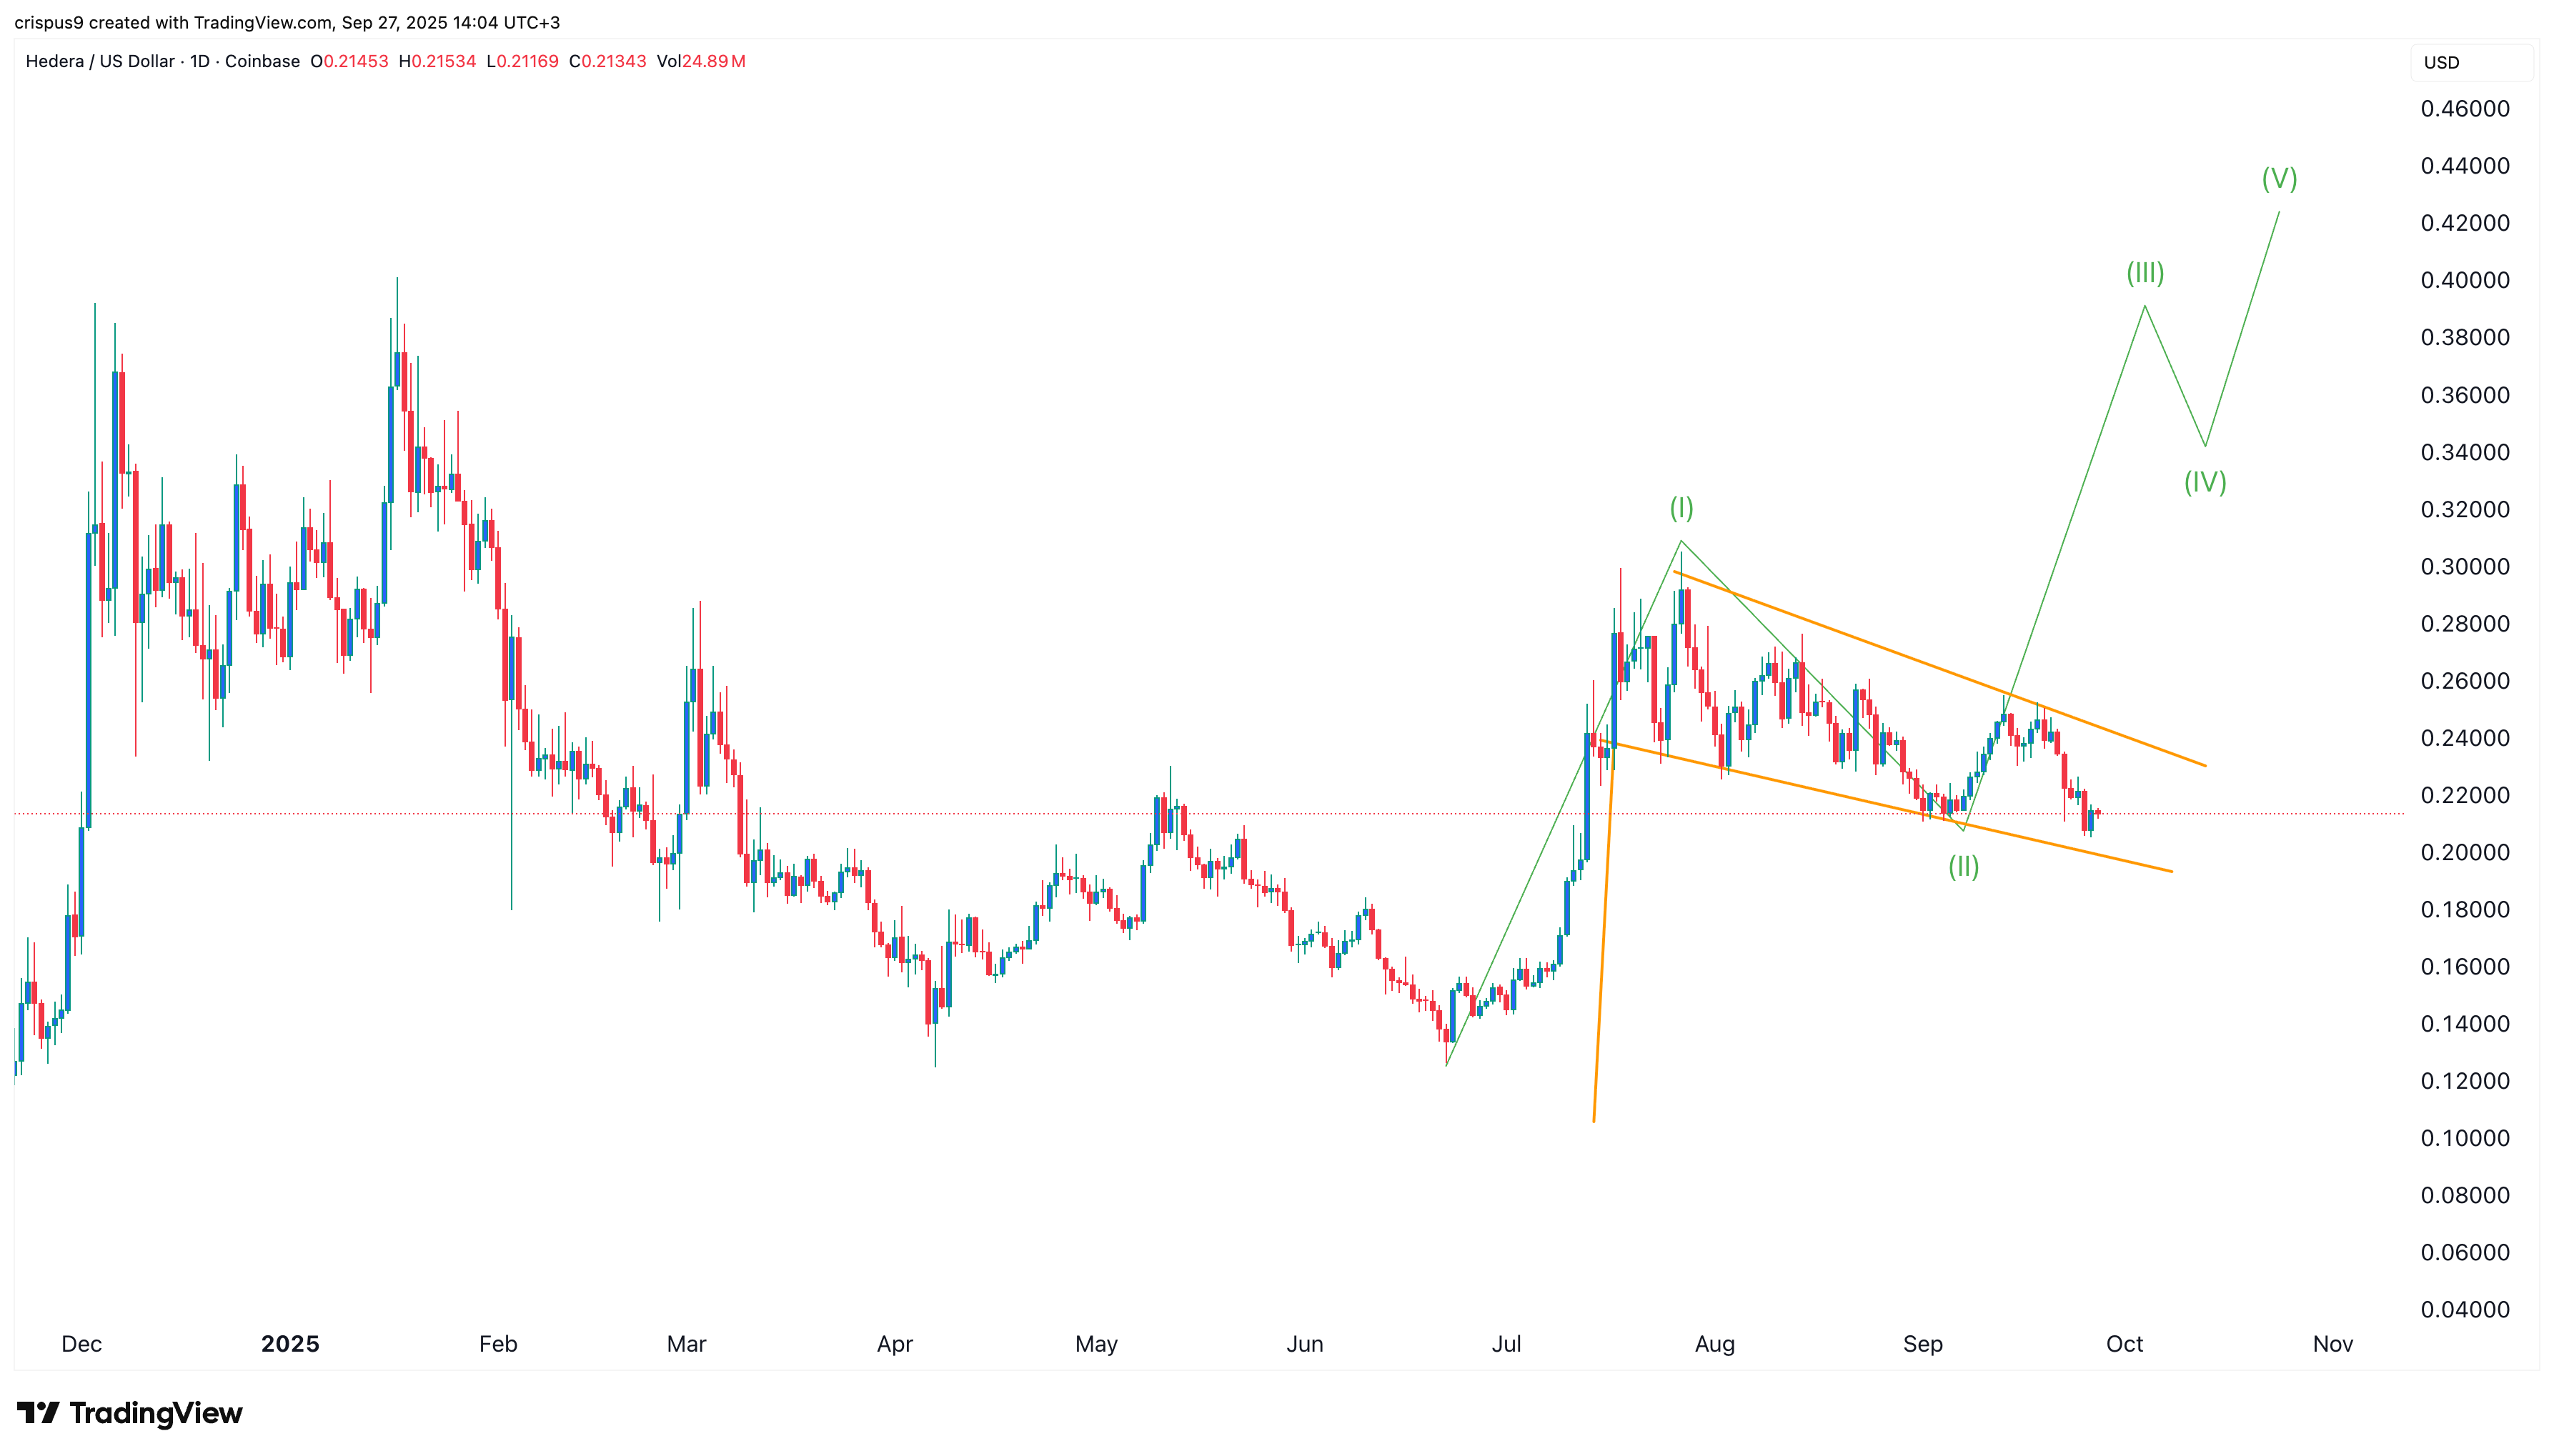
HBAR price Elliot Wave analysis
Hedera (HBAR) token dropped to $0.2147, with its volume and futures open interest falling to $193 million and $357 million, respectively.
Technical analysis suggests an eventual rebound in the HBAR price. A closer look shows that it rose from a low of $0.1265 on June 22 to a high of $0.3047 on July 27. This surge was the first phase of the Elliot Wave pattern.
The Hedera Price has now entered the second phase, characterized by a pullback that is between a 50% and 61.8% retracement of the first phase.
This phase is then followed by the third wave, which is usually the longest. In this case, it may jump to last year’s high of $0.40, which is about 85% above the current level.
The coin has formed other positive chart patterns. For example, it has formed a bullish flag pattern, which is characterized by a vertical line and a descending channel. This pattern resembles a hoisted flag, and it often leads to a strong bullish breakout.
Hedera Hashgraph price also remains above the 100-day Exponential Moving Average. That is a sign that bulls remain in control despite the recent pullback.
Hedera stablecoin growth and ETF approval
A potential catalyst for the HBAR price is the ongoing rebound of stablecoin supply. Data compiled by DeFi Llama shows that the USDC supply increased by $45 million over the last seven days. This rebound has brought its total supply to over $115 million.
Stablecoins are a crucial component of any layer-1 or layer-2 network, particularly following the signing of the GENIUS ActThis growth explains why Justin Sun’s Tron has become one of the biggest and most profitable networks in the crypto industry.
The other potential catalyst for the HBAR price is that the Securities and Exchange Commission is considering multiple ETFs. An HBAR ETF is likely to boost the price due to rising demand from American investors.
