Flare (FLR) Confirms Bullish Crossover as Price Targets 20% Rally - Technical Breakout Signals Major Momentum Shift

Flare's technical charts just flashed a signal that's got traders scrambling. The FLR token confirmed a bullish crossover pattern that historically precedes significant upward moves.
Technical Breakdown: What This Crossover Means
When key moving averages cross in this configuration, it typically signals shifting momentum. The pattern suggests buying pressure is overwhelming selling activity—and the charts are projecting a 20% price surge based on historical precedent.
Market Context: Riding the Wave
This isn't happening in isolation. The broader altcoin market's showing strength, but FLR's technical setup appears particularly compelling. The crossover confirmation adds quantitative weight to the bullish thesis.
Risk Factors: Always Read the Fine Print
Of course, technical patterns aren't guarantees—they're more like weather forecasts for market sentiment. And we all know how reliable financial forecasting can be—almost as trustworthy as a banker's handshake during a margin call.
The 20% target represents a clear technical objective, but market conditions can shift faster than a hedge fund manager's allegiance. Watch volume confirmation and broader market sentiment for validation.
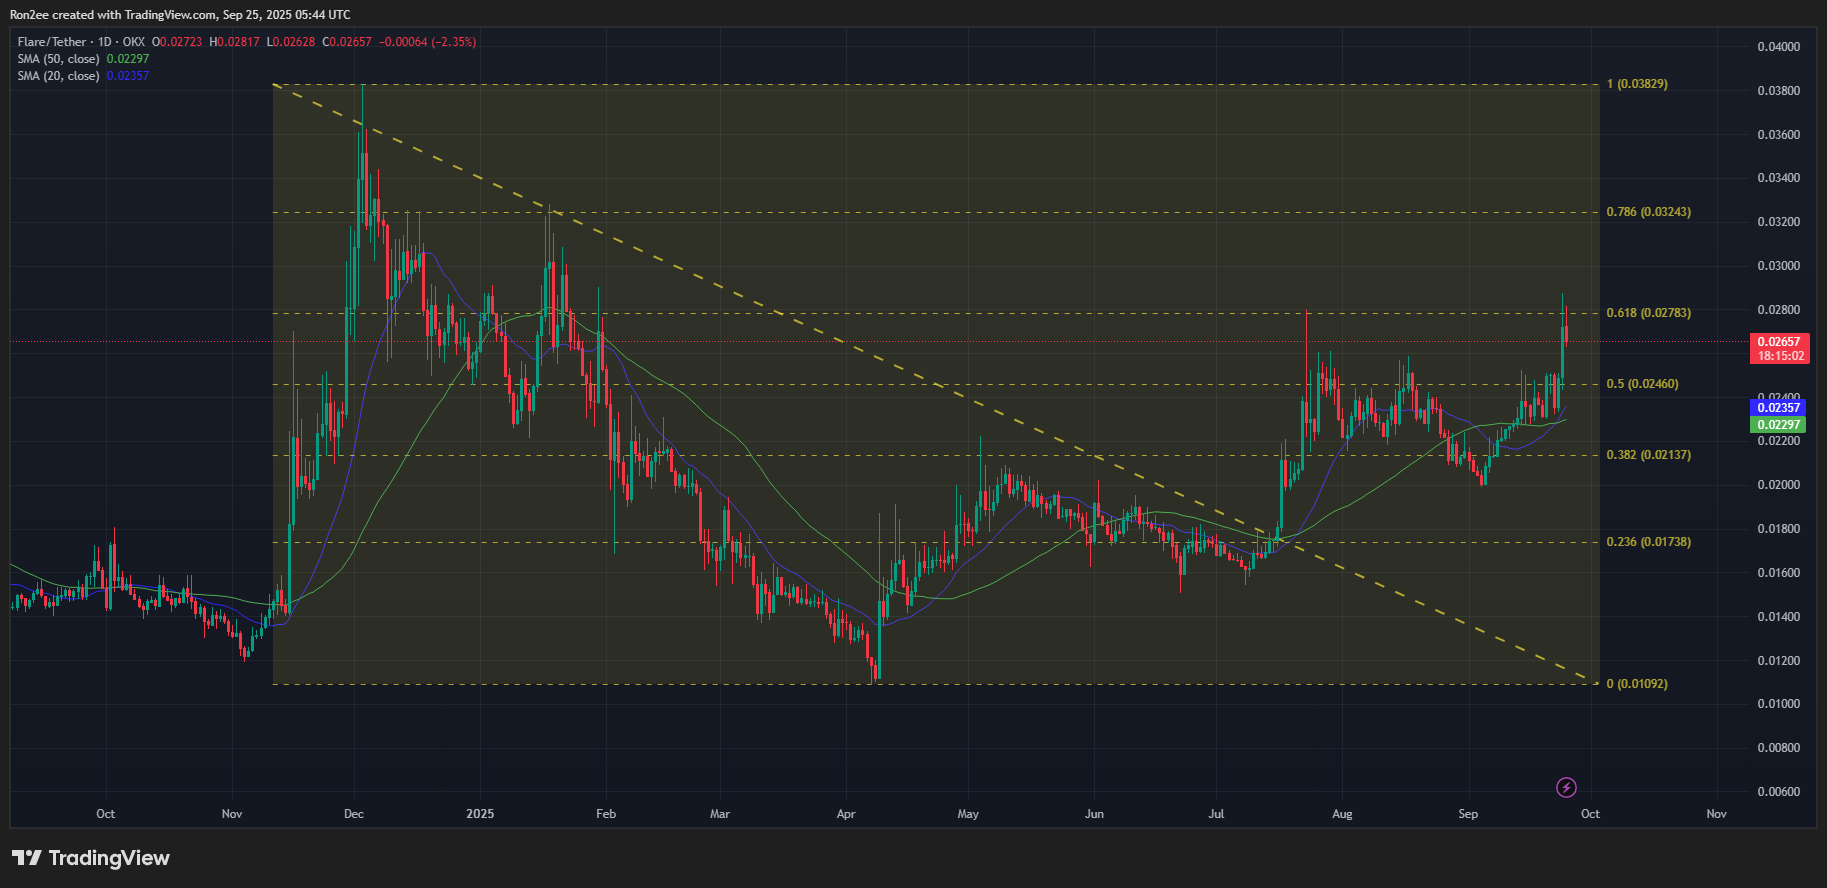 FLR price confirmed a bullish crossover of the 20-day and 50-day SMAs on the daily chart — Sep. 25 | Source: crypto.news
The 20-day simple moving average has now crossed above the 50-day SMA, which forms what is known as a bullish crossover in technical analysis. Traders typically view this as an early signal that the asset is beginning to MOVE out of consolidation and into an uptrend.
On top of that, momentum indicators like the MACD lines have pointed upwards. In technical analysis, this metric also points to the market gaining strength back after recent weakness.
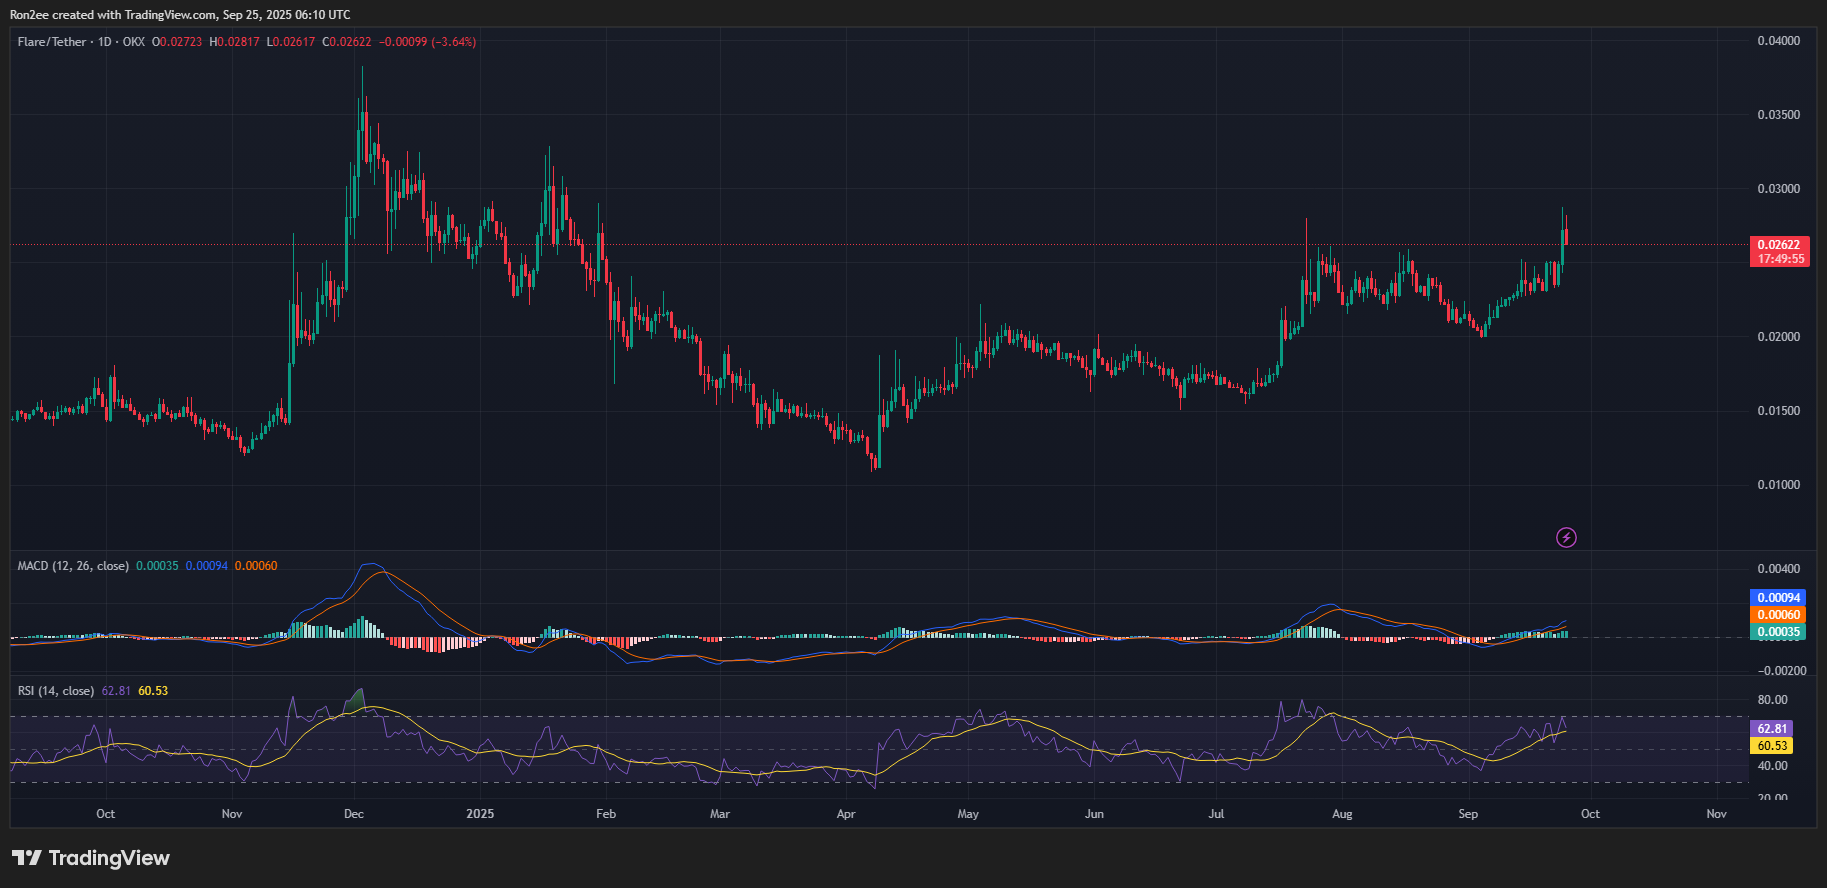
With community sentiment currently supportive and the RSI yet to move into overbought territory, the possibility of an upside continuation remains on the table in the short term.
Hence, FLR will most likely rally to $0.032, a target that aligns with the 61.8% Fibonacci retracement level. The target lies 23% above the current price level.
Meanwhile, in case the bullish momentum surrounding FLR fades out, the key support for the token lies at $0.023, its 20-day SMA.
Disclosure: This article does not represent investment advice. The content and materials featured on this page are for educational purposes only.
