Solana Price Eyes Bullish Reversal as 21 EMA Holds Strong

Solana stages a dramatic comeback as technical indicators flash green.
The 21-Day Defense Line
Solana's 21-day exponential moving average isn't just holding—it's forming an impenetrable barrier against further declines. The cryptocurrency bounces off this critical level like a trampoline, defying bearish pressure with every test.
Technical Momentum Builds
Buyers swarm back into the market, pushing SOL past resistance levels that seemed solid just days ago. The charts show classic reversal patterns emerging—bullish engulfing candles and rising volume confirm the shift in sentiment.
Market Psychology Shifts
Traders who missed the bottom now scramble for position, creating that self-fulfilling prophecy Wall Street loves to pretend doesn't exist. The fear of missing out trumps the fear of losing—for now.
Solana's resilience at this key technical level suggests the correction might be over. But in crypto, the only certainty is that traditional finance guys will still be explaining why it's all a bubble at the next all-time high.
Solana price key technical points
- 21 EMA Support: Price has respected this level throughout the uptrend.
- High Confluence Zone: Value area high overlaps with major support, strengthening reversal probability.
- Trading Range: $197–$260 defines the immediate high timeframe structure.
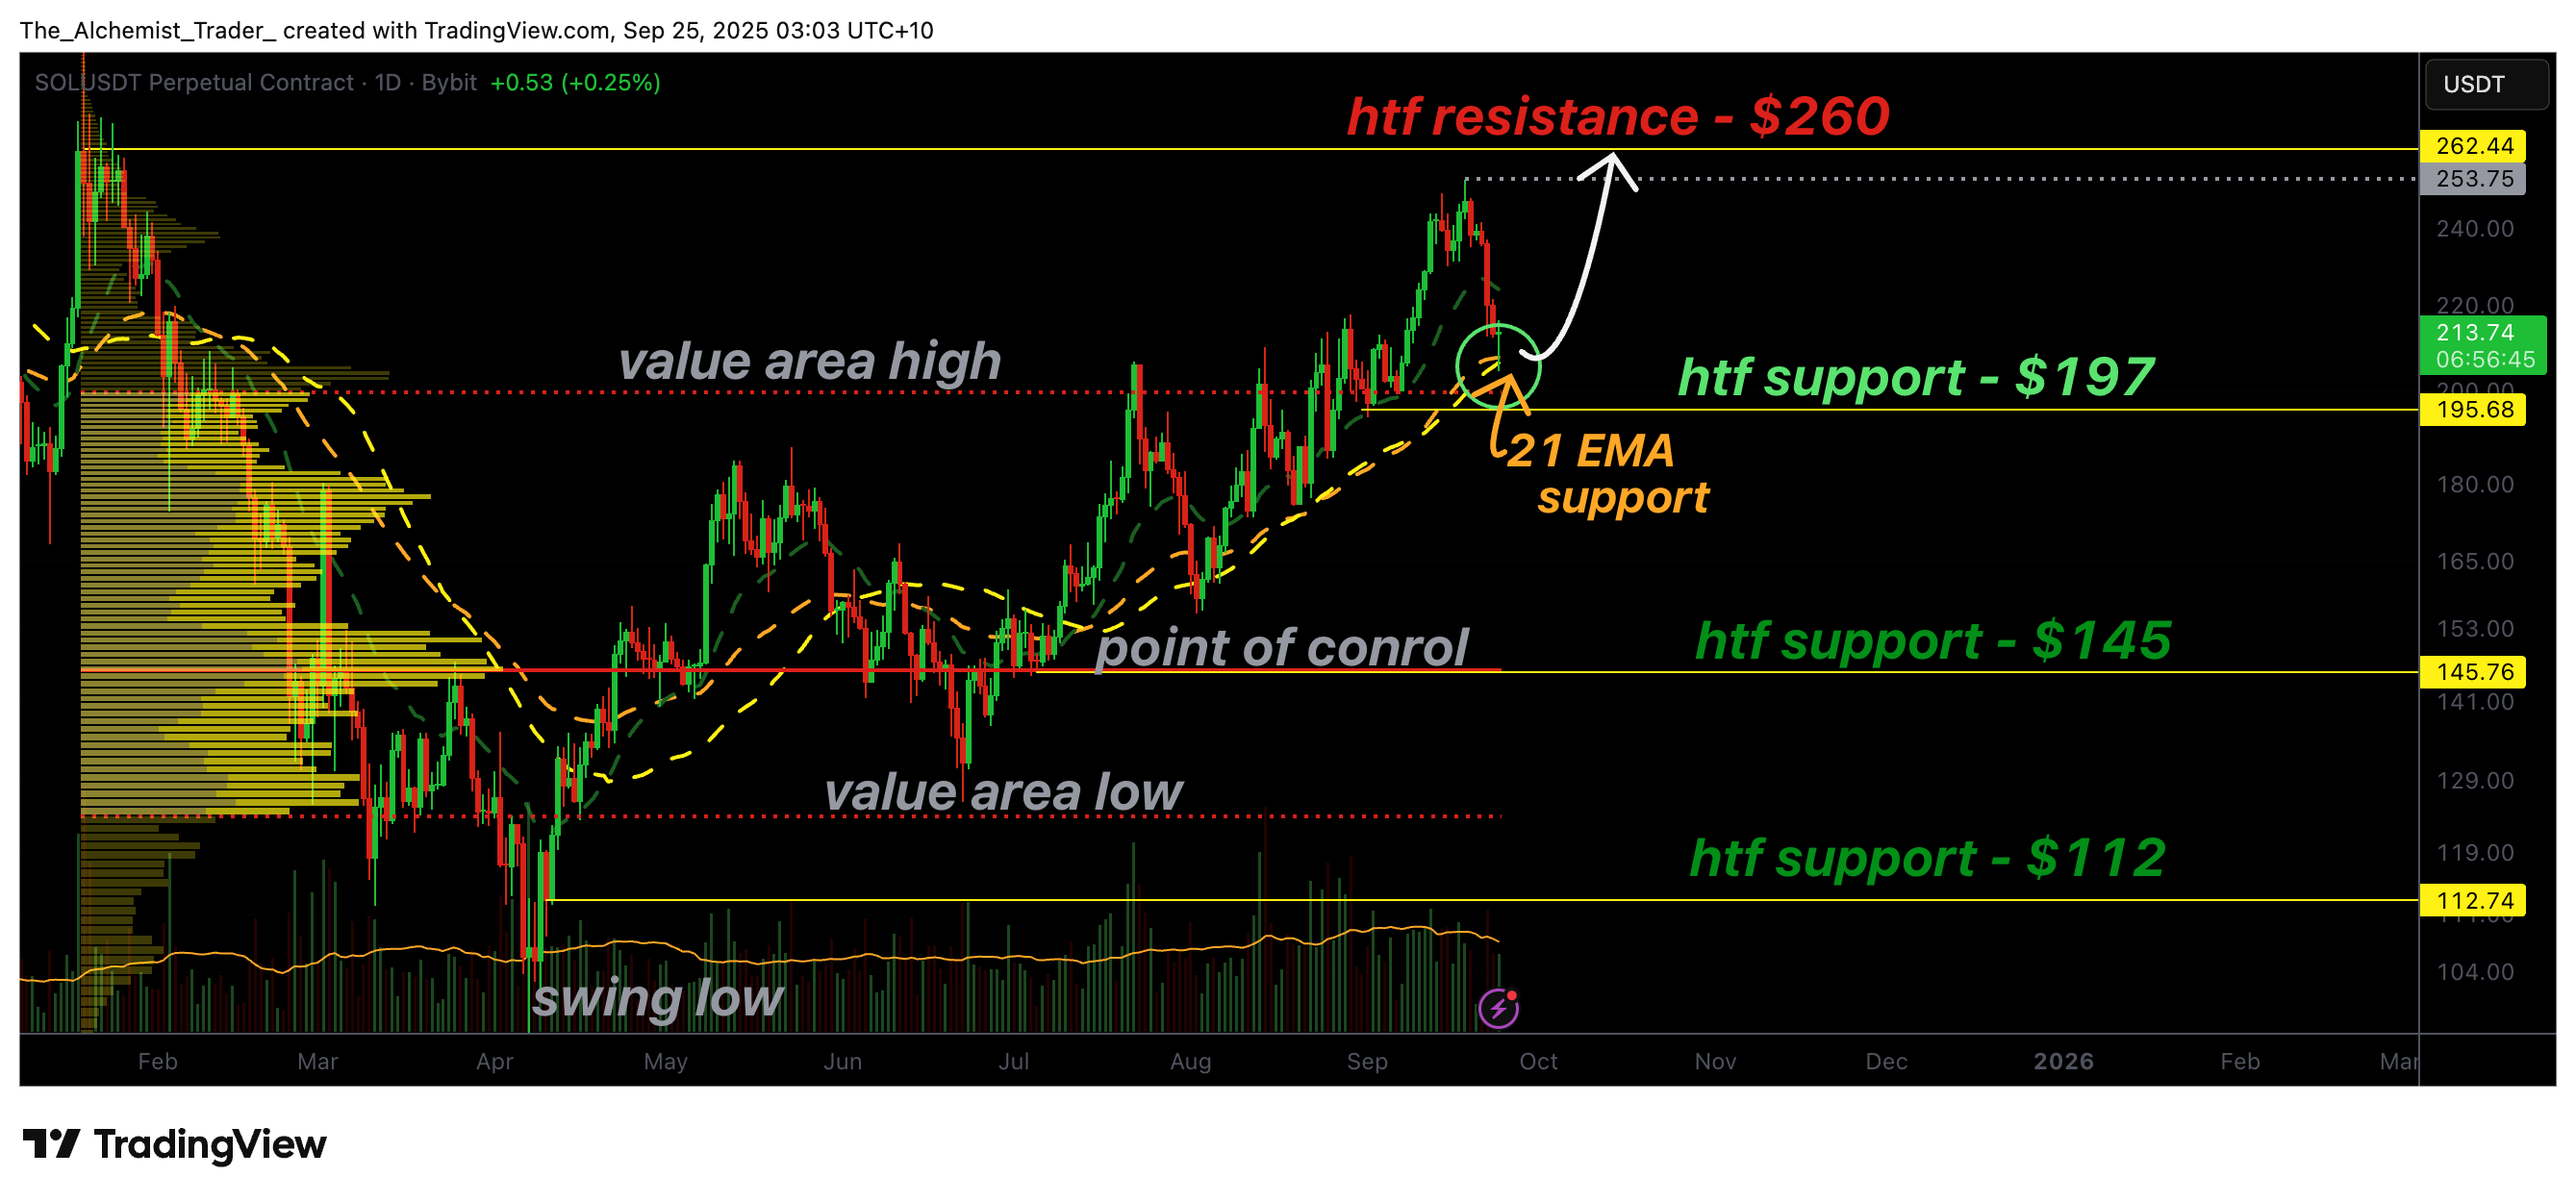
Solana’s technical picture remains constructive as long as the 21 EMA holds. This dynamic moving average has acted as a reliable support since the reclaim of the value area low and point of control, guiding the bullish structure of consecutive higher highs and higher lows.
Currently, Solana has retraced into a major support area around $197, which is also in confluence with the value area high. This overlap between structural support and high-volume nodes significantly strengthens the probability of a reversal. Such confluence levels often serve as springboards for renewed upside momentum, provided demand continues to flow into the market.
Volume analysis further supports the bullish case. Recent sessions have shown inflows into bullish nodes, suggesting that buyers are defending support zones. However, for a sustained reversal, this influx of demand must persist and translate into decisive bullish price action, such as engulfing candles on higher timeframes.
Looking ahead, the key upside target remains $260, the next high-timeframe resistance. Solana previously front-ran this level, indicating its importance as a supply zone. The current structure establishes a trading range between $197 and $260, with a bullish bias as long as EMA support continues to hold and momentum builds.
What to expect in the coming price action
If Solana sustains its defense of the $197 support zone and 21 EMA, a bullish rotation toward $260 resistance is likely. The overall bullish trend remains intact, with the potential for new highs if volume inflows strengthen further.
