Solana Plunges Below $220: Is a Major Correction Looming?

Solana's rally hits a wall as prices tumble below critical support.
Technical Breakdown
The $220 level wasn't just psychological - it represented a key consolidation zone from last month's trading. Breaking downward suggests weakening momentum despite the ecosystem's recent developer growth.
Market Psychology Shift
Traders who bought the dip at $240 now watch nervously as liquidation triggers loom near $210. The fear isn't just about SOL - it's about altcoin season hitting a potential roadblock.
Institutional Response
Surprisingly, options volume indicates more puts than calls at the $200 strike price for October. Smart money positioning for further downside while retail keeps 'buying the dip' - a classic Wall Street versus Main Street showdown.
Remember when traditional finance said crypto volatility was 'uninvestable'? Meanwhile, the S&P moves 0.5% and they call it a correction.
This could be healthy profit-taking or the start of something deeper. Either way, buckle up.
Solana price outlook
Solana faces a new headwind this week with a token unlock of over 500K SOL, worth roughly $116 million, set to hit the market. Although the amount is only about 0.09% of SOL’s circulating supply, its timing, coming amid broader market weakness, could amplify selling pressure.
The release coincides with a broader $517 million wave of token unlocks across projects such as Worldcoin and Trump-linked tokens, and these clustered releases often create short-term volatility as traders reposition and liquidity spikes.
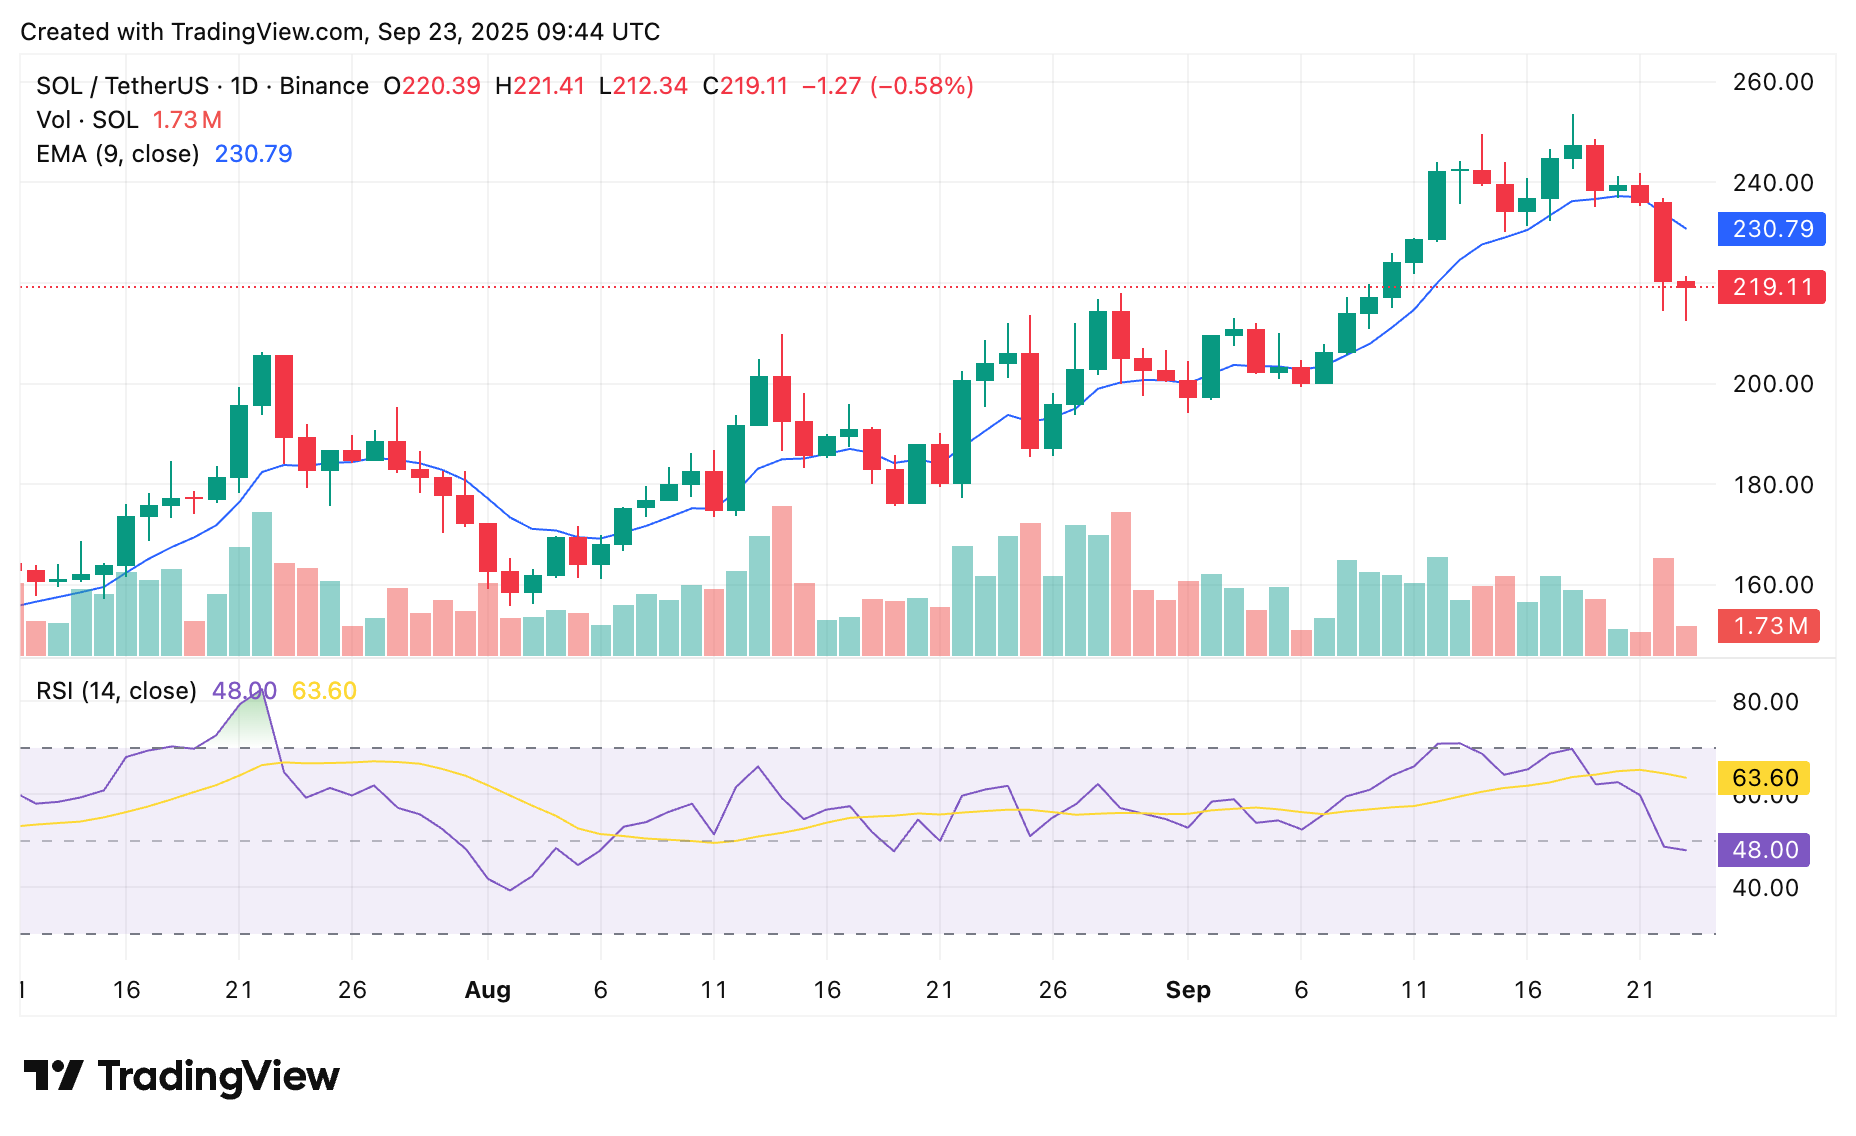
On the technical side, indicators are leaning bearish. Solana price is now below its 9-day exponential moving average (EMA), which currently sits at $230.79. That level had acted as short-term support during the rally, and losing it signals a possible shift in momentum.
The Relative Strength Index has dropped to 48, down from above 60 earlier this week. That puts it below the neutral 50 line, indicating that bullish momentum has faded. The RSI is not yet in oversold territory, leaving room for further downside if selling pressure mounts.
SOL is testing support near the $210–$215 zone, with heavier trading volume accompanying the latest move lower. A break below this area could open the door to a deeper pullback toward the $200 level, while a bounce above $225 WOULD be an early sign of recovery.
