Bitcoin Bull Run May End Within 60 Days According to Top Analyst

Bitcoin's explosive rally faces a critical countdown as market experts sound the alarm.
The Countdown Begins
Top analysts project Bitcoin's bull run could collapse within just 60 days—sending shockwaves through crypto portfolios. Market patterns mirror previous cycle peaks, suggesting this parabolic surge might be running on borrowed time.
Timing the Tops
Historical data reveals similar momentum patterns preceding major corrections. The current cycle's intensity—while staggering—follows familiar exhaustion signals that veteran traders recognize all too well.
Why This Time Isn't Different
Despite institutional adoption narratives, market psychology remains brutally consistent. Greed indicators flash red while retail investors pile in—classic signs of a pending reversal that even Wall Street's 'this time it's different' crowd can't ignore.
Because nothing says sustainable growth like watching your portfolio swing 30% between coffee breaks.
TLDR
- Bitcoin bull market is 93% complete with only 60 days of growth remaining according to analyst Cryptobirb
- Current cycle has lasted 1,007 days with peak projected between October 19 – November 20, 2025
- Historical data shows Bitcoin peaks occur 492 days after halvings, aligning with the April 2024 halving timeline
- Bear market could follow with potential 66% correction bringing Bitcoin to around $37,000
- Technical indicators show support at $97,094 with resistance at $117,058
Bitcoin’s current bull market could be approaching its final phase. Analyst Cryptobirb suggests the leading cryptocurrency has approximately 60 days of growth remaining.
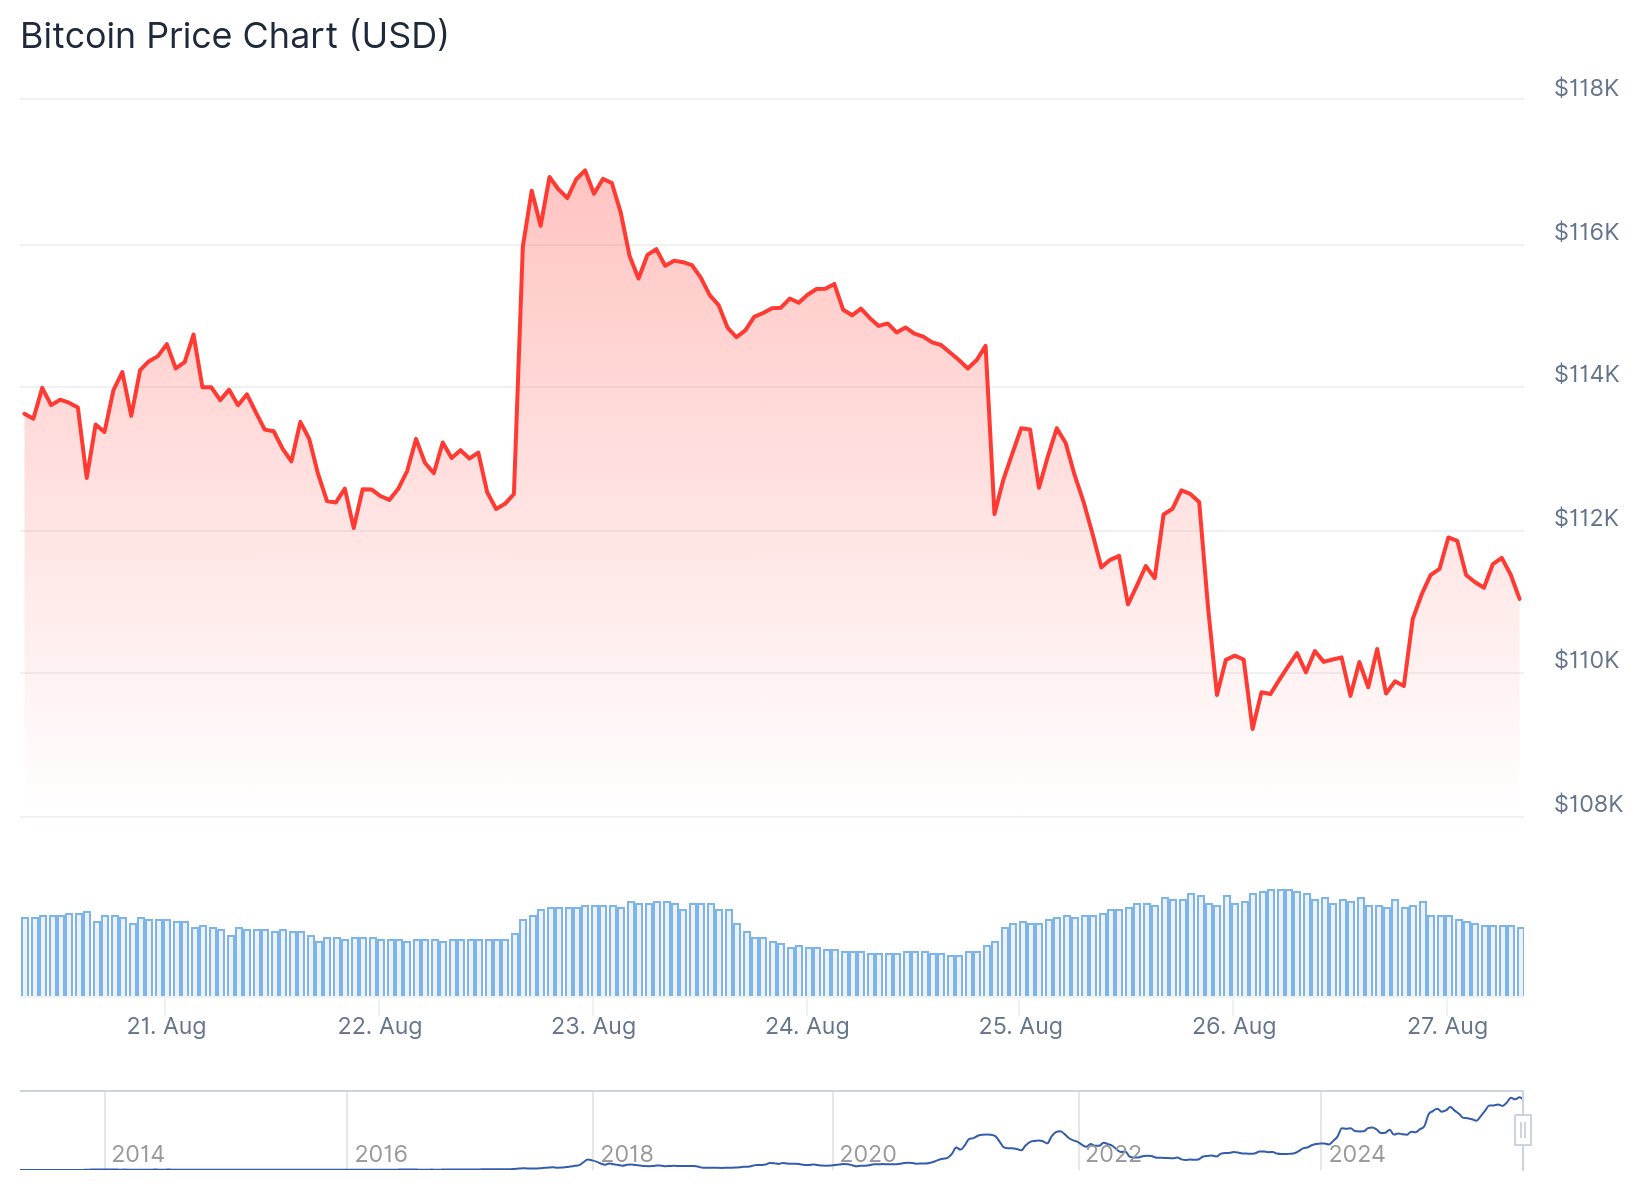
The assessment comes as Bitcoin recently hit a new all-time high above $124,000 earlier this month. However, momentum has shifted with the price retreating below $109,000 this week.
Cryptobirb’s analysis indicates bitcoin is 93% through its current bull cycle. The cycle began after the April 19, 2024 halving event and has lasted 1,007 days so far.
2/ Halving numbers update → peak timing:
• 2012: 366 days
• 2016: 526 days
• 2020: 548 days
• 2024 halving = Apr 19 → 492 days ago.
Target window = Oct 19 – Nov 20, 2025 (518–580 days).
That’s another reason explaining why it's 60 days away. pic.twitter.com/YtY9ZaW3ca
— CRYPTO₿IRB (@crypto_birb) August 25, 2025
Historical cycle patterns support this timeline. Previous Bitcoin bull runs lasted 350 days (2010-2011), 746 days (2011-2013), 1,068 days (2015-2017), and 1,061 days (2018-2021).
The current cycle is tracking toward approximately 1,060 to 1,100 days total. This places the projected peak between late October and mid-November 2025.
Halving Cycles Point to October Peak
Bitcoin halving events provide additional context for the timing prediction. Previous halvings have led to price peaks roughly 492 days later on average.
Based on the April 2024 halving, this suggests a target window between October 19 and November 20, 2025. The timeline aligns with Cryptobirb’s 60-day projection from the current date.
Historical bear markets following these peaks have lasted 364 to 411 days. Average losses during these periods reached approximately 66%.
If this pattern repeats, Bitcoin could retrace toward $37,000 in the next bear cycle. The bearish phase may not begin until 2026 based on historical timing.
Technical and Seasonal Factors
Current technical indicators show Bitcoin above key support levels. The weekly chart indicates mean-based support at $97,094 and resistance at $117,058.
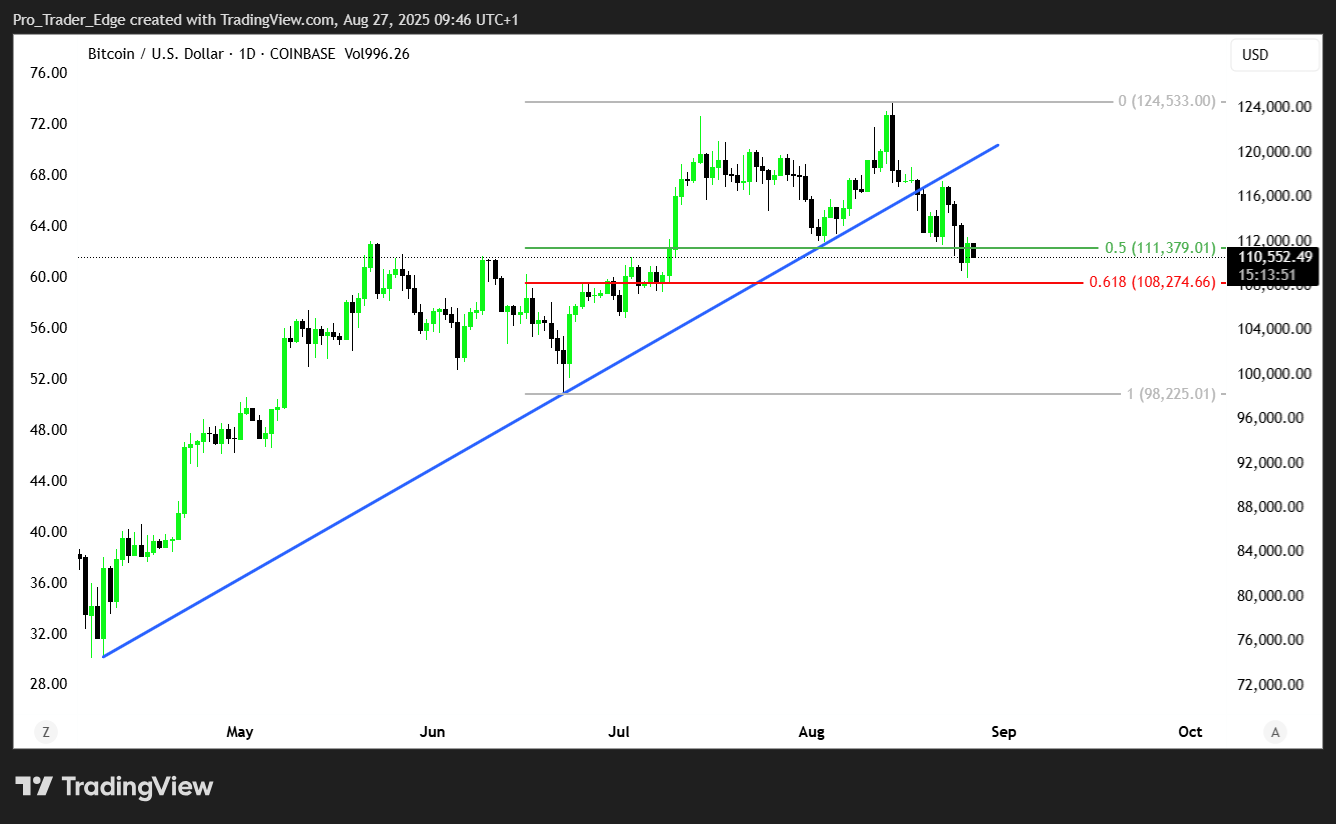
Bitcoin is currently holding just above the $110,000 support floor after recent volatility. Movements below this level could signal a bearish trend according to the analysis.
Seasonal patterns also support the projected timeline. August and September have historically been weaker months for Bitcoin performance.
October and November typically rank among the strongest months for Bitcoin. This seasonal strength aligns with the anticipated cycle peak window.
On-chain metrics remain relatively healthy despite recent price weakness. Mining costs sit around $97,124 with no immediate signs of miner capitulation.
Exchange-traded fund flows have shown recent outflows totaling $194 million on August 21. However, overall institutional positions remain substantial according to the analysis.
The convergence of cycle mathematics, halving events, and seasonal patterns suggests a potential finale in the fourth quarter of 2025.
