Bitcoin (BTC) Price Prediction: $2.7 Billion Whale Dump Triggers Massive Leverage Flush - What’s Next?

Whales just unleashed a $2.7 billion tsunami—and the entire market felt the ripple.
The Great Leverage Purge
Massive positions got liquidated faster than you can say 'overleveraged.' That $2.7 billion dump didn't just move markets—it reset them. Leverage traders learned the hard way: when whales swim, smaller fish get washed away.
Market Mechanics Exposed
This wasn't just selling—it was a systematic flush. The cascade triggered stop-losses, amplified volatility, and reminded everyone that crypto's 'free market' still dances to whale-sized wallets. Classic finance would call this manipulation—here, we call it Tuesday.
Where Bitcoin Goes From Here
Short-term pain often sets up long-term gains. Flushed leverage means cleaner charts, reduced overhangs, and a market that's actually standing on fundamentals rather than borrowed momentum. But let's be real—since when has crypto ever been about fundamentals?
The only certainty? Volatility never takes a day off—and neither do the whales who feed on it.
TLDR
- Bitcoin crashed below $109,000 after a whale sold 24,000 BTC worth $2.7 billion
- All Bitcoin wallet cohorts have shifted into distribution mode, creating sell-side pressure
- The $105,000 level has emerged as the key support zone before potential deeper corrections
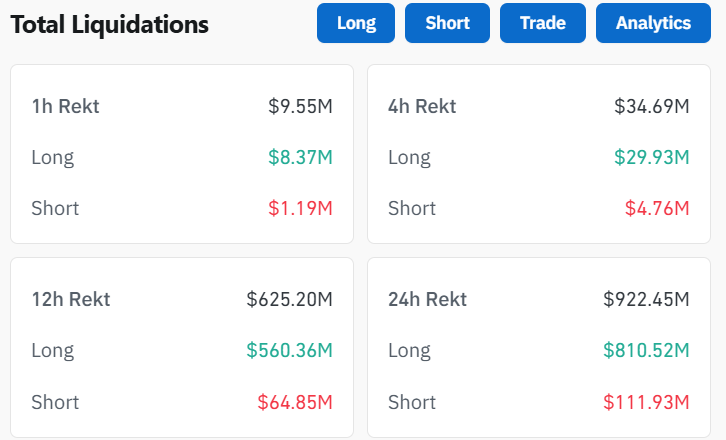
- Over 205,000 traders were liquidated in a $930 million liquidation event
- Bitcoin’s seasonal weakness period aligns with the current pullback
Bitcoin experienced a sharp decline below $109,000 during Asian trading hours on Tuesday. The drop marked a seven-week low for the cryptocurrency.
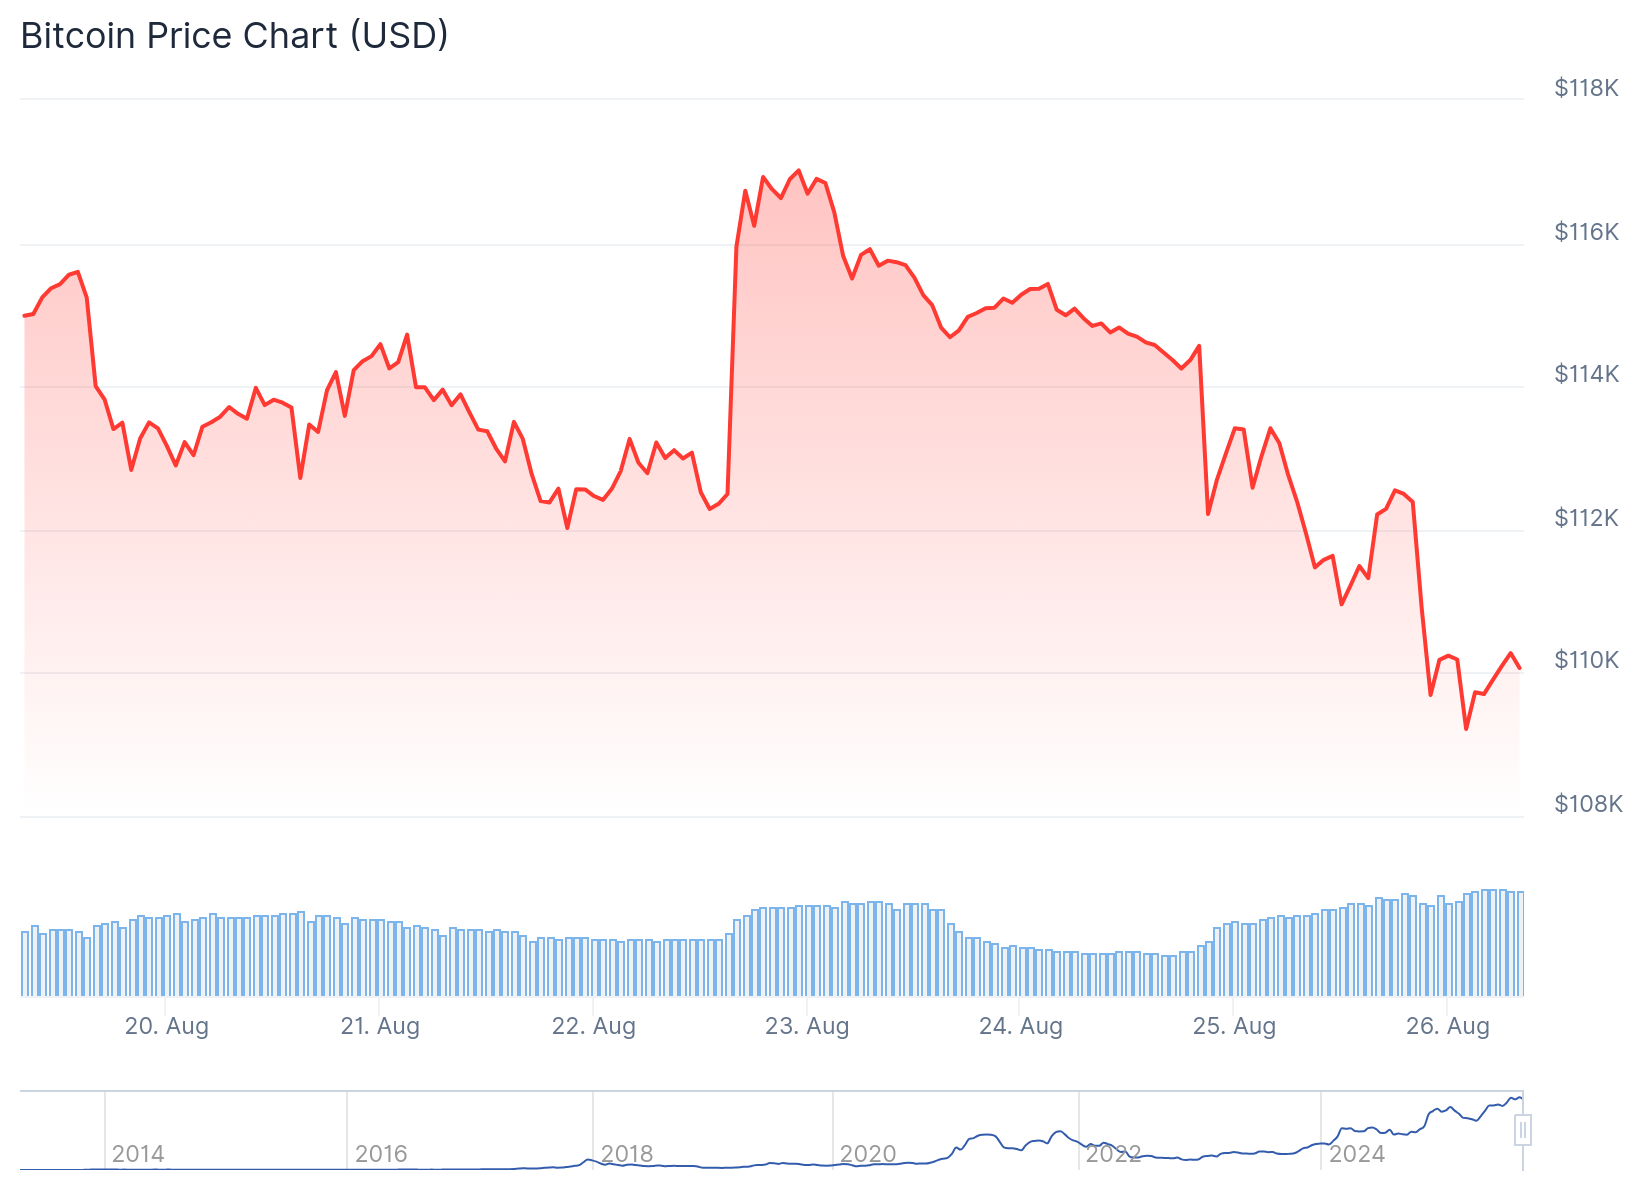
A massive whale transaction triggered the selloff. One entity sold 24,000 Bitcoin worth over $2.7 billion in a single batch. This large sale caused Bitcoin to plummet $4,000 within hours.
The broader crypto market felt the impact immediately. Total market capitalization fell by $205 billion in 24 hours, dropping to $3.84 trillion. This represents the lowest level since August 6.
Liquidations swept across exchanges as Leveraged positions unwound. Over 205,000 traders were liquidated, with total liquidations exceeding $930 million. Long Bitcoin positions faced the heaviest losses during the flush.
Onchain Data Shows Distribution Pattern
Data from Glassnode reveals all bitcoin wallet cohorts have now entered distribution mode. The 10-100 BTC group leads this selling activity across different wallet sizes.
All $Bitcoin cohorts have now decisively moved into distribution, led by the 10–100 $BTC group. The uniformity across cohorts highlights broad sell-side pressure emerging in the market. pic.twitter.com/zVZkaPN2Tf
— glassnode (@glassnode) August 25, 2025
Smaller holders between 0-1 BTC continue accumulating since the recent peak. Wallets holding 1-10 BTC resumed buying below $107,000. However, the 10-100 BTC group turned into net sellers after Bitcoin crossed $118,000.
Large holders above 1,000 BTC remain consistent distributors. The 100-1,000 BTC group shows mixed behavior around the $105,000 level. This price point has emerged as the critical support zone.
Bitcoin’s realized price data supports this analysis. One to three-month holders have an average cost basis of $111,900. Longer-term holders from three to six months sit at $91,630, while 6-12 month cohorts average $89,200.
The wide gap between these levels shows heavy short-term positioning NEAR recent highs. This contrasts with longer-term holders who accumulated closer to $90,000.
Bitcoin Price Prediction
The current pullback aligns with Bitcoin’s historical seasonal patterns. August to September typically marks a weaker period for the cryptocurrency.
Asia’s “ghost month” runs from August 23 to September 21 this year. This period often coincides with reduced risk appetite and increased profit-taking among traders.
Since 2017, Bitcoin has averaged a 21.7% decline during ghost month periods. The 2017 ghost month saw a 39.8% drop, while 2021 recorded a 23% decline.
Based on these historical patterns, a retreat toward $105,000-$100,000 remains within normal seasonal expectations.
Crypto trader Roman Trading highlighted structural concerns about Bitcoin’s recent rally. BTC/EUR has not reached new all-time highs since last year, suggesting recent gains depend more on US dollar weakness than organic demand.
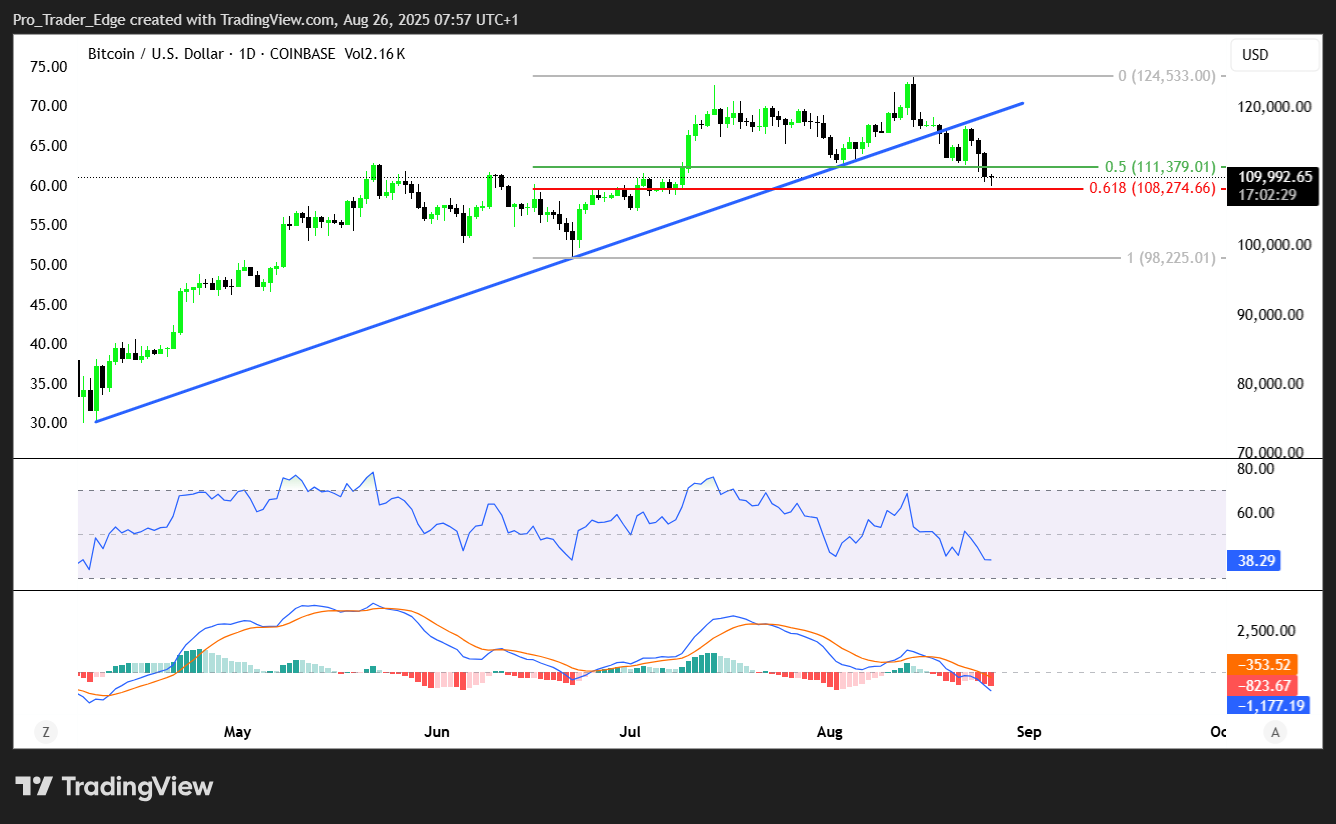
Bitcoin currently trades around $110,000 after briefly touching the $109,000 support level. The 12% correction from recent highs remains shallow compared to previous bull market pullbacks.
The September 2017 and 2021 corrections during bull markets saw Bitcoin retreat 36% and 24% respectively. A similar correction this September could push prices toward $87,000 before the bull market resumes.
Glassnode warned that Bitcoin dropped below the average cost basis of recent investors who accumulated during the May to July rally period at $110,800.
