Solana (SOL) Primed for $210 Breakout as ETF Inflows Hit $164M—Here’s Why

Solana’s price is coiled for a potential surge to $210, fueled by a staggering $164 million ETF inflow wave. Institutional money is voting with its wallet—while retail still tries to time the dip.
### The ETF Effect: Liquidity Tsunami Ahead
Wall Street’s sudden love affair with SOL isn’t charity. Those nine-figure inflows suggest traders are front-running what crypto ETFs always deliver: a self-fulfilling liquidity prophecy. The last time numbers looked this bullish, SOL rallied 300% in 90 days.
### Technicals Scream ‘Overbought’—And Nobody Cares
RSI levels have been redlining for weeks. Traditional analysts would call this a correction warning. Crypto traders? They’re seeing a launchpad. SOL’s network activity—developer commits, NFT volume—just hit ATHs while Bitcoin miners were still rebooting their rigs.
### The Cynic’s Corner: Greater Fools Welcome
Let’s be real—half these ETF buyers couldn’t explain Solana’s proof-of-history if their bonus depended on it. But when the institutional FOMO train leaves the station, you either grab a seat or watch your portfolio get left in the dust. Again.
TLDR
- Solana trades at $182-193 range, targeting $210-218 resistance levels within two weeks
- REX-Osprey SOL staking ETF has seen seven consecutive weeks of inflows totaling $164 million
- Network metrics show 31% growth in monthly transactions to 2.44 billion with stablecoin supply rising 6.2%
- Technical analysis reveals bullish MACD momentum despite trading below key $200 resistance
- Analysts predict 65% probability of reaching $210 target if SOL breaks above $200 decisively
Solana currently trades NEAR $193, down from its recent high of $210 but still more than double its 2024 low of $95. The token faces a critical test at the $200 resistance level that could determine its short-term direction.

Multiple technical indicators suggest a potential breakout scenario. The MACD histogram shows a reading of 0.5014, indicating building bullish momentum despite recent price declines. The RSI sits at 51.50 in neutral territory, providing room for movement in either direction.
The REX-Osprey SOL + Staking ETF continues attracting investor interest. The fund recorded net inflows of $25.8 million last week, up from $3.5 million the previous week. Total inflows have reached $164 million over seven consecutive weeks, with assets under management now exceeding $183 million.
Network Growth Supports Price Action
Solana’s underlying network metrics demonstrate strong growth across key areas. Monthly transactivons jumped 31% to 2.44 billion, making it one of the most active blockchain networks. The number of active addresses has risen to over 90 million.
Stablecoin supply on solana increased 6.2% over the past 30 days, reaching $11.6 billion. Adjusted transaction volume grew 6% to $186 billion. These metrics indicate real usage growth beyond speculative trading activity.
The network’s staking yield has climbed to 7.52% according to StakingRewards data. This provides additional income potential for long-term holders and ETF investors seeking yield-generating exposure.
Solana has formed an ascending channel pattern on daily charts. The token remains above its 20-day moving average at $177.94 and longer-term averages including the 50-day at $172.58 and 200-day at $157.68.
Solana Price Prediction
A decisive break above $200 WOULD likely trigger algorithmic buying and stop-loss covering. Success at this level opens the path toward $210, representing approximately 15% upside from current prices.
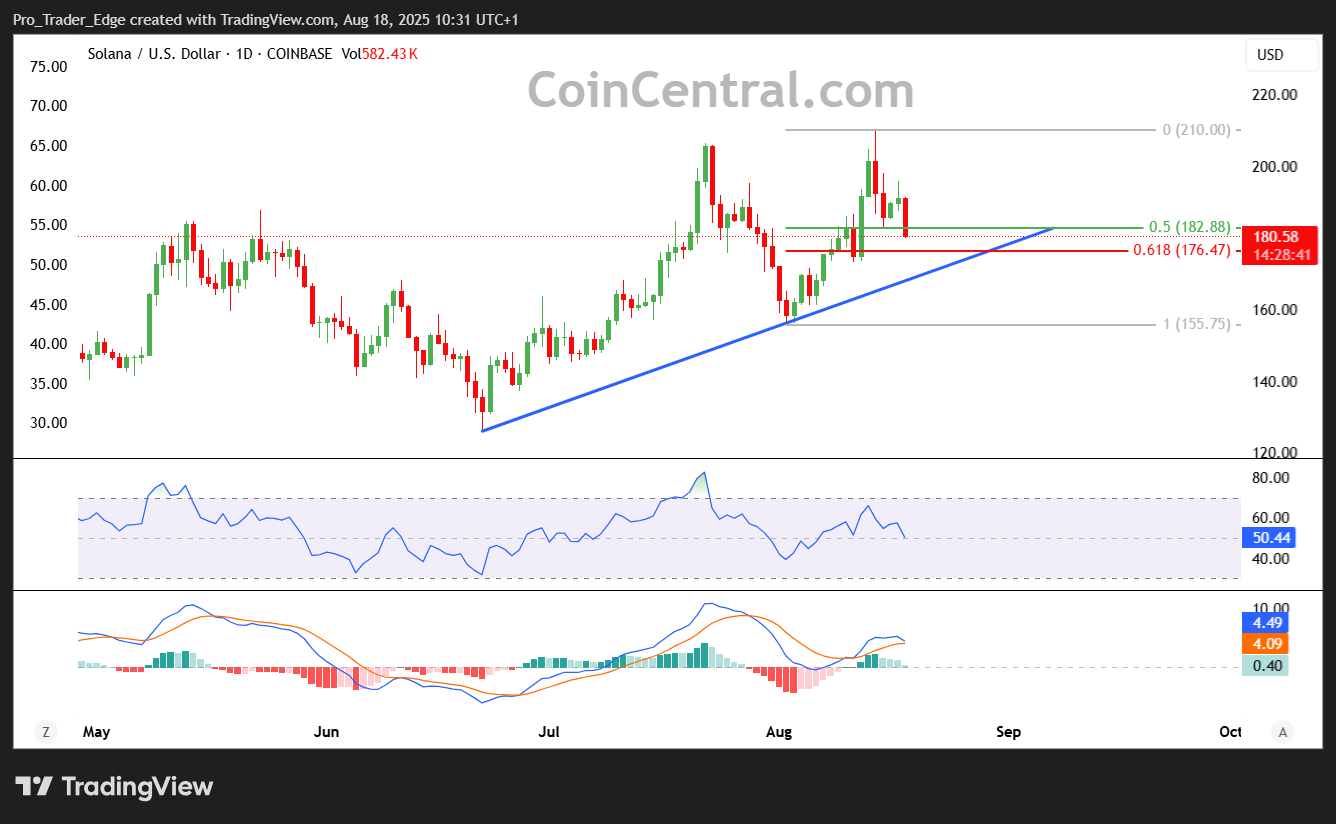
The bearish scenario centers on failure to reclaim $200 and subsequent breakdown below $177.94 support. This would activate the $172 target, representing roughly 6% downside risk. Critical support exists at $155.83 and $144.85 for deeper declines.
Volume analysis shows $573 million in 24-hour Binance spot trading, sufficient to support moves through key resistance levels. The 14-day average true range of $10.98 indicates continued volatility potential.
Conservative investors should wait for confirmed breakout above $200 with volume before establishing positions. More aggressive traders might consider accumulating near the $177-180 support zone with $172 as a stop-loss level.
The timeline for reaching $210 extends through early September, with critical confirmation expected within 5-7 trading days as SOL approaches the $200 decision point.
