Ethereum Shatters Resistance—$5,000 Target Now in Play as Bull Run Accelerates

Ethereum's bulls just bulldozed through a critical resistance level—and now the $5,000 price target looks like the next stop. Traders are piling in as the breakout gains momentum, leaving skeptics scrambling to explain why they called it 'overbought' at $3,000.
### The Technical Breakout
A clean breach of the multi-month resistance zone has flipped the script. Chartists are now eyeing Fibonacci extensions and liquidity pools above $4,800—because in crypto, why aim small when leverage lets you dream bigger?
### Institutional FOMO Kicks In
With ETH futures open interest hitting record highs, even Wall Street's latecomers are reluctantly admitting this isn't just 'retail hype.' Though let's be honest—their 'strategic allocation' memos only arrived after the 100% rally.
### The Cynic's Corner
Sure, the rally's exciting—until some hedge fund manager blames 'macro conditions' for liquidating their over-leveraged long at the exact top. Again.
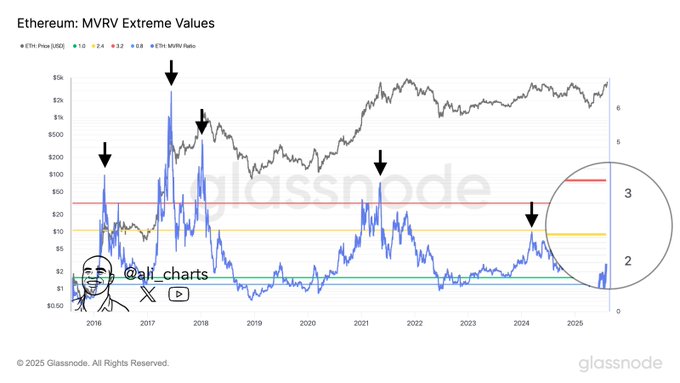
MVRV Ratio Indicates Bullish Conditions For Ethereum Price
Ethereum MVRV ratio is showing signs of continued bullish conditions. The MVRV ratio compares Ethereum’s market value with its realized value, providing insights into whether the cryptocurrency is overvalued or undervalued.
ETH – MVRV Chart | Source: X
Currently, ethereum price MVRV ratio is rising, indicating that the asset may still have room to appreciate before entering an overbought condition. However, the current levels are still lower than the extremes seen in 2017 and 2021, when Ethereum’s price saw sharp corrections.
Despite the current rise in MVRV, Ethereum price has not yet reached levels that would suggest an immediate market top. This indicates that, although a price correction remains possible, the cryptocurrency may still be in a phase of bullish momentum.
Furthermore, the MACD indicator is showing a positive crossover, signaling a shift in momentum towards buyers. The MACD line recently crossed above the signal line, confirming growing buying pressure.
This crossover, along with the green histogram bars, suggests ethereum price could keep rising in the short term.Traders often use the MACD to spot potential trend reversals, and this momentum shift is viewed positively..
Ethereum Price Breakout and Resistance Levels
Building on the momentum shift, Ethereum price breakout above the 1.5-year resistance is a significant development. The price recently surpassed the $4,000 mark, reaching $4,348. This breakthrough confirms the strength of the move. Resistance levels act as psychological barriers, and surpassing them often leads to further gains.
The next key level for ETH price is $4,500. If it breaks this barrier, $5,000 could be within reach. If this happens, the bullish momentum is likely to continue, driving ETH Price higher. Maintaining price above these levels will be crucial for its future direction.
Bullish Outlook Supported by Moving Averages
In addition to the breakout and MACD signals, Ethereum price has been consistently trading above its 50-week moving average, a key indicator of mid-term trends. This moving average is widely used by traders to assess market trend. Staying above it signals mid-term bullishness.
The rise above this moving average, coupled with a breakout above key resistance levels, suggests the crypto is entering a new phase of upward price action.
Ethereum price recently broke key resistance levels, signaling a strong upward trend. Positive indicators like the MVRV ratio and MACD support this move. However, the MVRV ratio suggests potential overbought conditions.
