Dogecoin’s 2025 Chart Echoes 2020 Blueprint – Is a Run to $0.70 Imminent?

Dogecoin's price action is flashing deja vu—and traders are leaning in hard. The meme coin's current setup mirrors its 2020 consolidation pattern before that jaw-dropping 12,000% rally. Same wedges, same volume dry-up, same skeptical Wall Street analysts scrambling for explanations.
The Technical Deja Vu
DOGE's 4-hour chart shows an eerie replay of the 2020 base-building phase. Tightening Bollinger Bands, RSI coiling at 45—it's all there. Last time this happened? A 90-day silence before liftoff to $0.70.
Market Psychology at Play
Retail traders are piling into perpetual swaps while institutional players remain conspicuously absent. Classic Dogecoin: the people's pump versus the suits' skepticism. One hedge fund manager called it 'financial nihilism' before quietly allocating 0.5% of their portfolio 'just in case.'
The Cynical Kick
Meanwhile, traditional finance still can't decide if this is a revolution or a glorified casino—while conveniently ignoring that their 2008 CDS market was just gambling with extra steps.
TLDR
- Dogecoin has surged 19.7% over two weeks, outpacing Bitcoin’s 8.75% gain during the same period
- Technical analysis shows DOGE price patterns similar to December 2020, before its historic 36,000% rally
- Current price has broken through key resistance levels at $0.173 and $0.196, with $0.25 as the next target
- Analyst CryptoKaleo suggests potential rally to $1-$2.4 based on historical trend patterns
- A 36,000% rally from current levels would require DOGE to reach $72, pushing market cap above $2 trillion
Dogecoin has gained 19.7% over the past two weeks, outpacing Bitcoin’s 8.75% increase during the same timeframe. The meme coin’s recent performance comes as Bitcoin reaches new all-time highs against the dollar, lifting the broader cryptocurrency market.

The price movement has caught the attention of crypto analyst CryptoKaleo, who points to striking similarities between current market conditions and December 2020. Back then, Dogecoin struggled after its previous all-time high before beginning what would become a legendary 36,000% rally.
#Dogecoin / $DOGE
DO YOU SEE IT?
Dogecoin is currently in the same place it was in late December of 2020 before it had its last legendary run.
Multi-dollar Doge is a magnet.
Don't sleep on the king of the memes. pic.twitter.com/xRNhsG5GEf
— K A L E O (@CryptoKaleo) July 11, 2025
According to the analyst’s chart patterns, dogecoin appears to be following the same trend structure from late 2020. The price had been declining along a trend line before hitting upward momentum, followed by a downtrend that marked the end of the price decline.
Price Breaks Through Key Resistance Levels
Dogecoin’s recent rally began after retesting the $0.142 range lows on June 22nd. Since then, the cryptocurrency has been making higher lows and higher highs, creating a classic bullish pattern that has held strong through July.

The $0.173 resistance level that previously stopped DOGE’s advance was broken as Bitcoin’s rally provided market-wide support. The real test came at $0.196, where a bearish order block from mid-June had created strong supply pressure.
On July 11th, Dogecoin managed to break through this supply zone. The $0.196 level is now expected to flip into support where DOGE can bounce from during future pullbacks.
However, the On-Balance Volume (OBV) remains below June’s high, suggesting buying pressure may be cooling off. This technical indicator measures cumulative buying and selling pressure over time.
Next Target Set at $0.25 Resistance Zone
Technical analysis points to a potential 27% rally toward the $0.25 resistance zone. Liquidation heatmaps show a small possibility of DOGE dipping to the $0.19 liquidity cluster, but the more likely scenario involves continuation toward the $0.23 magnetic zone.
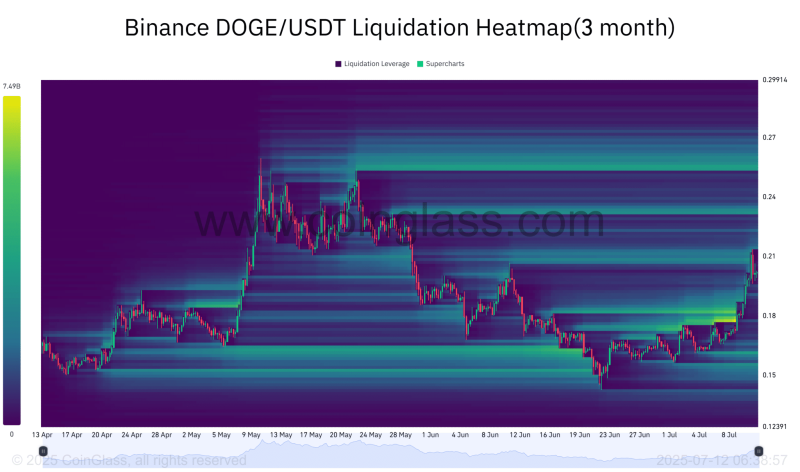
Price tends to get pulled toward these liquidity areas where large orders are concentrated. The $0.23-$0.25 supply zone represents the next major hurdle for the meme coin’s advance.
CryptoKaleo’s analysis suggests that if historical patterns repeat, Dogecoin could target the $1 mark as a “no-brainer” level. The analyst’s chart indicates a possible top as high as $2.4 before the trend cycle completes.
For traders, the current setup presents opportunities to go long around mid-range levels and target the 27% rally to the range high. However, caution is advised when price approaches $0.25, as this level may provide strong resistance.
A 36,000% rally from current levels WOULD require Dogecoin to reach $72, pushing its market cap above $2 trillion. This scenario appears unlikely given DOGE’s unlimited supply and constant inflation through new token creation.
The price rally has been supported by Bitcoin’s $11,000 weekly gain after breaking out of a descending channel. On-chain data suggests Bitcoin isn’t overheated yet, which could continue supporting DOGE and other meme coins in the coming weeks.
Until a clean breakout above $0.25 occurs with successful retest as support, Dogecoin is expected to continue trading within its current range. The technical setup appears favorable, but traders should maintain tight risk management given the volatile nature of meme coin trading.
