Dogecoin (DOGE) Defies Market Slump: On-Chain Data Reveals Smart Money Accumulation

Dogecoin''s price action tells one story—but chain analytics scream another.
Whales are loading up while retail panics
Network metrics show accumulation patterns reminiscent of early 2021, back when DOGE became the people''s rocket fuel. This time? The ''dumb money'' might miss the boat again—too busy chasing vaporware DeFi projects with 50-page whitepapers.
The cynical take
Wall Street would call this ''contrarian investing.'' In crypto? We call it buying the damn dip before Elon tweets another meme.
TLDR
- DOGE failed to break through the $0.20 resistance level and continues declining from the $0.1880 zone
- Price is currently trading below the $0.180 level and 100-hourly moving average with bearish momentum
- On-chain metrics show potential accumulation as exchange net position turned negative in early June
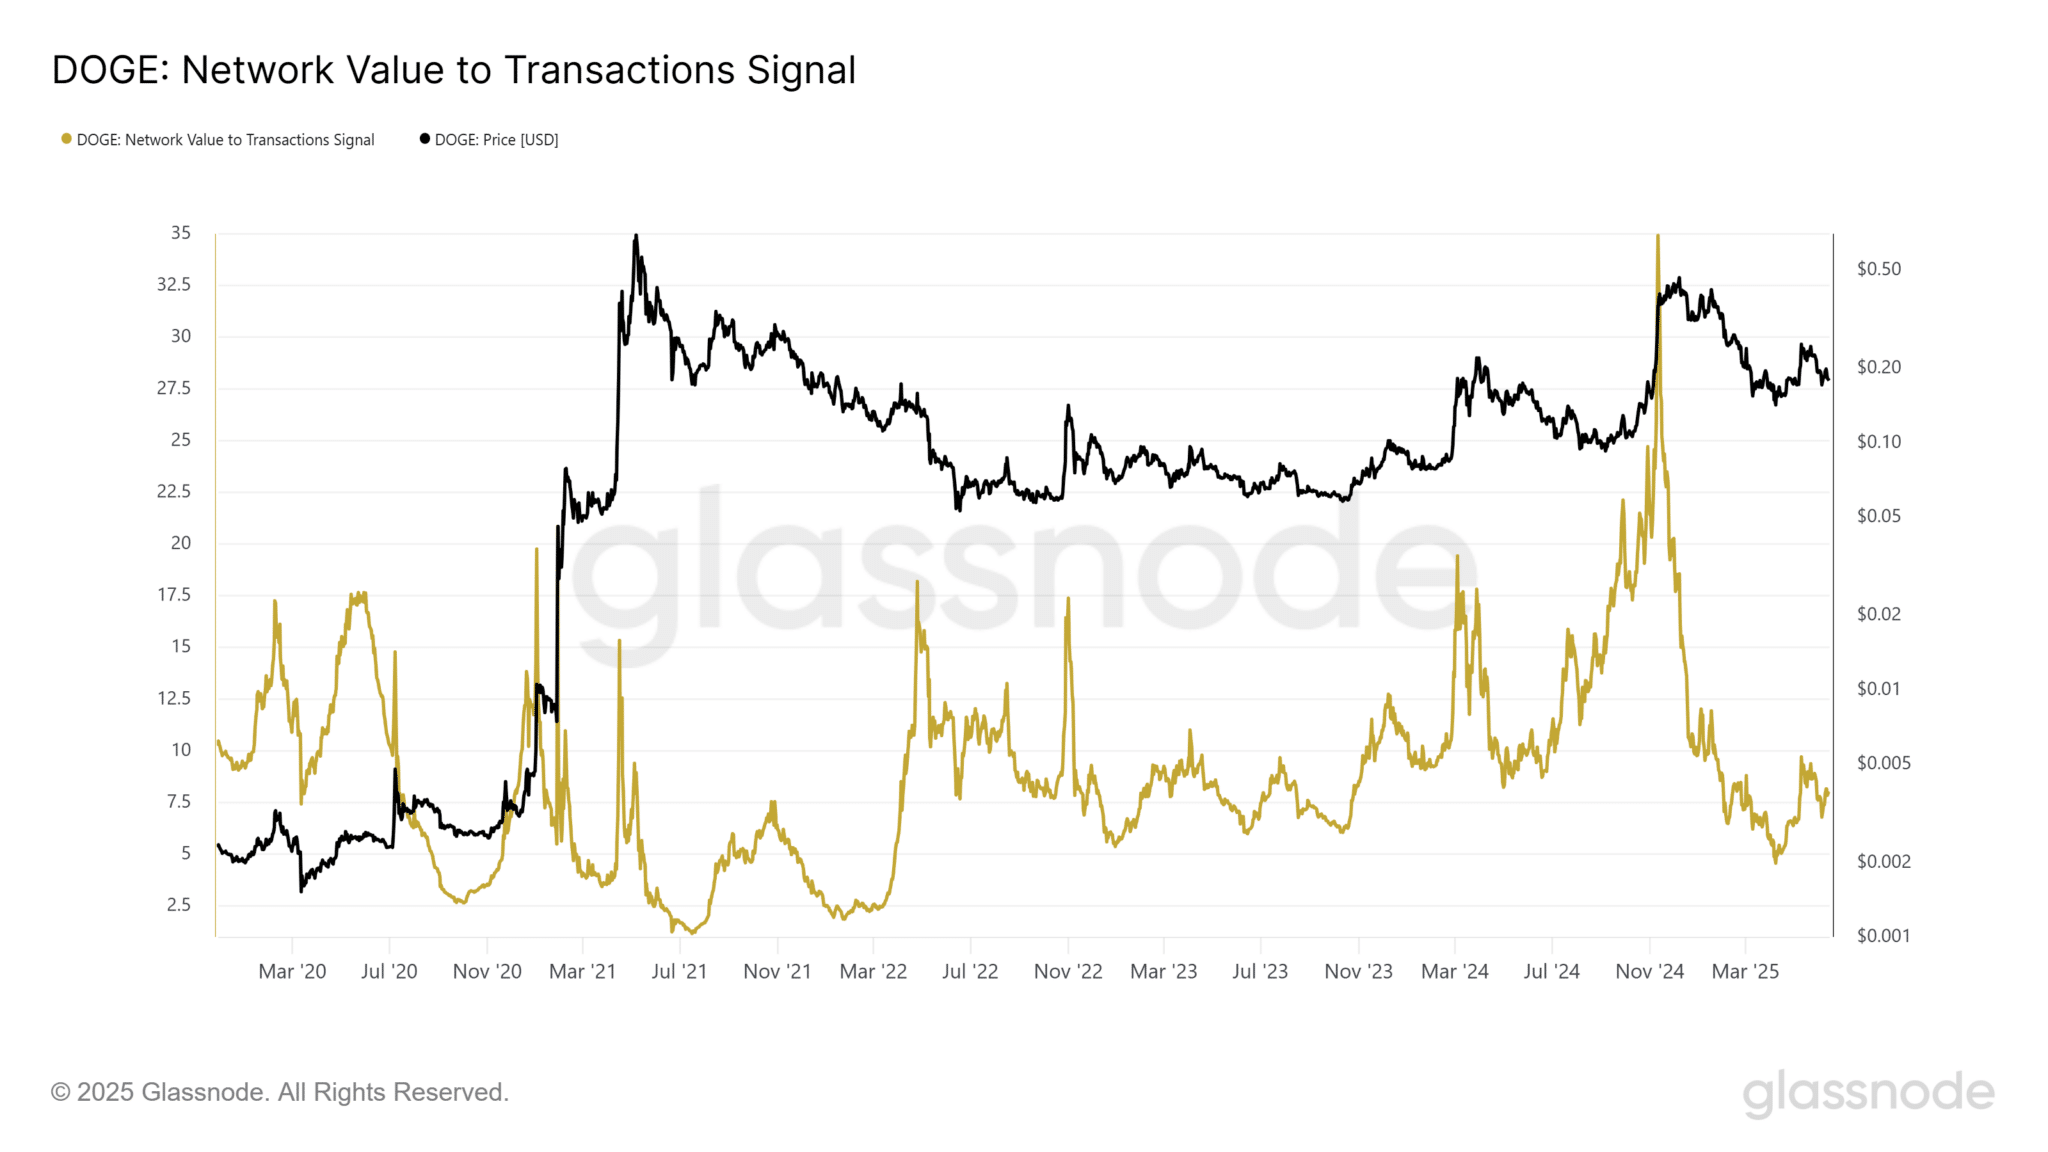
- Network Value to Transactions Signal indicates DOGE may be undervalued, presenting a possible buying opportunity
- Technical analysis suggests further downside risk with potential retest of $0.17 support level
Dogecoin price action remains under pressure as the popular meme coin struggles to find its footing in the current market environment. The cryptocurrency has been unable to overcome key resistance levels, with bears maintaining control over price direction.
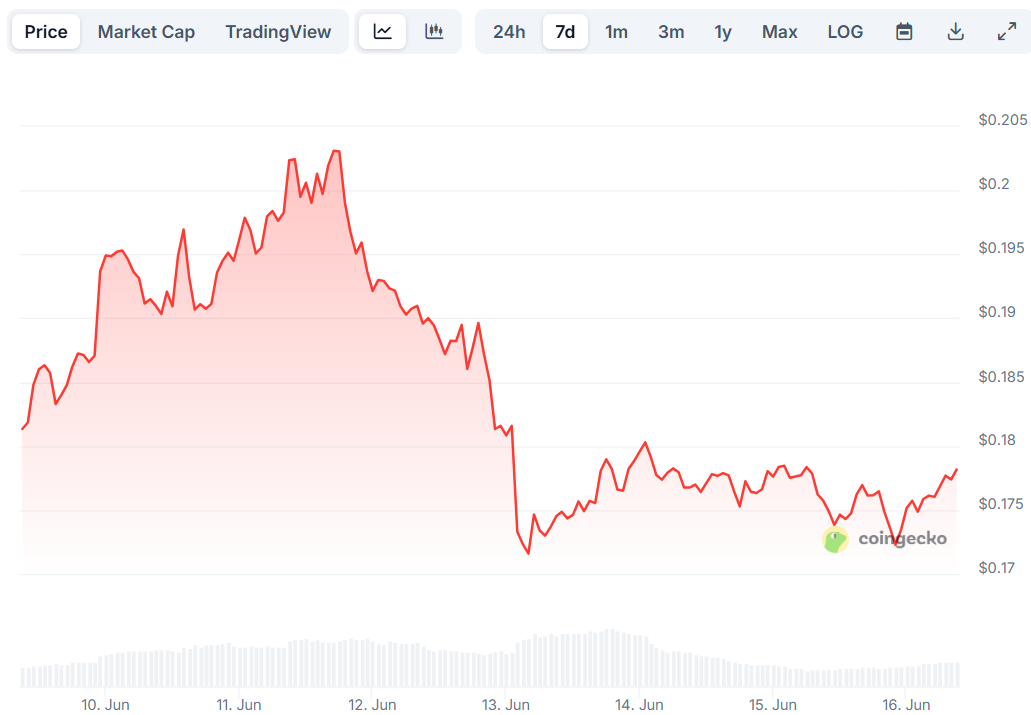
The leading meme coin failed to clear the $0.1880 zone and has since declined below both the $0.1800 and $0.1750 levels. Bears pushed the price even lower, breaking through the $0.1720 level with a low forming at $0.1695.
DOGE is currently trading below the $0.180 level and the 100-hourly simple moving average. A short-term bearish trend line has formed with resistance at $0.1760 on the hourly chart.
Technical Resistance Levels Present Challenges
The swing market structure remains firmly bearish, with price action sitting below the 78.6% Fibonacci retracement level based on the early May rally. Immediate resistance on the upside sits NEAR the $0.1760 level, followed by the first major resistance at $0.1785.
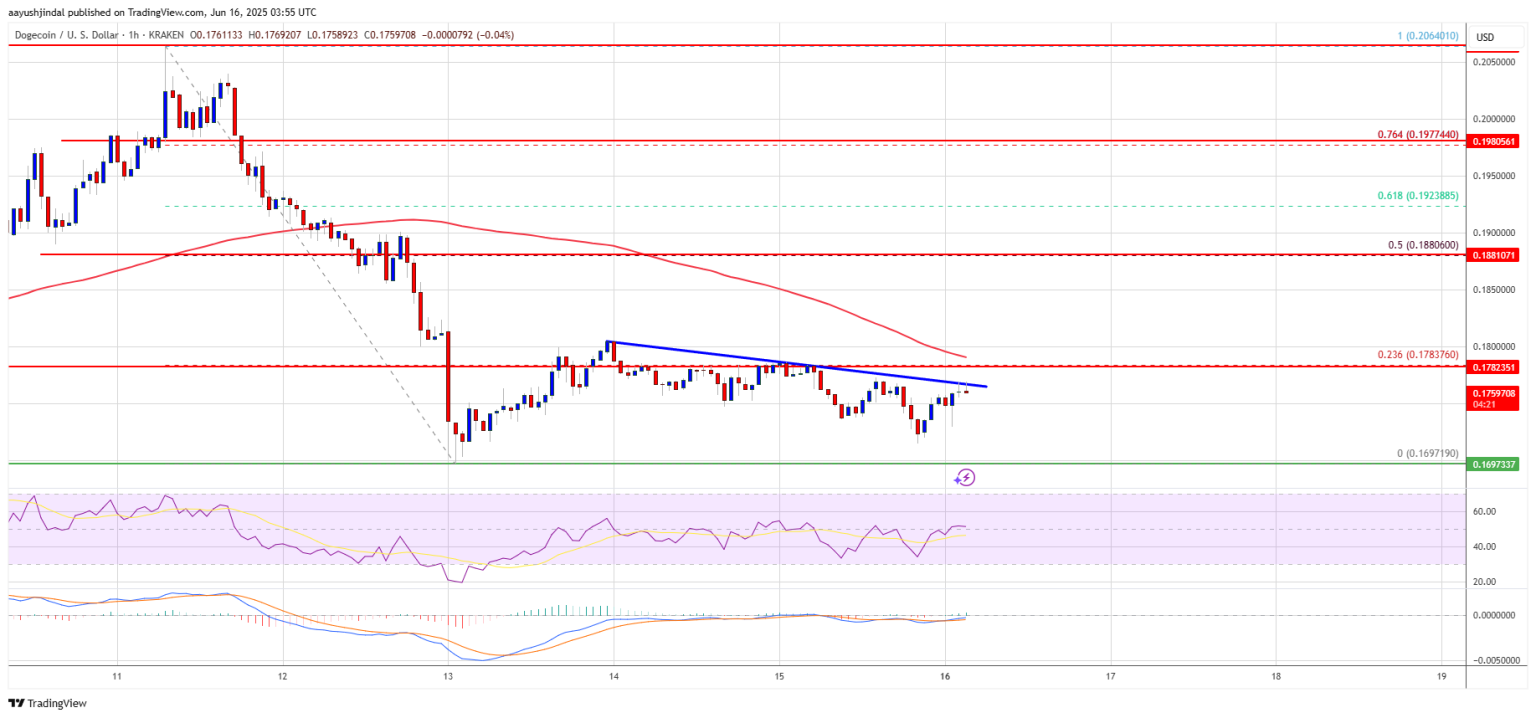
The next major resistance level is positioned near $0.180. A close above this resistance could potentially send the price toward the $0.1880 resistance level, which aligns with the 50% Fibonacci retracement level.
Any gains beyond this point might push the price toward the $0.200 level, with the next major target for bulls at $0.2120. However, current technical indicators suggest this scenario may be challenging in the near term.
Support Levels and Downside Risks
If Doge fails to climb above the $0.180 level, another decline could begin. Initial support on the downside is positioned near the $0.1720 level, with the next major support at $0.1700.
The main support sits at $0.1680. A downside break below this support could trigger further declines toward the $0.1550 level or even $0.1525 in the near term.
DOGE has a liquidity cluster at the local low of $0.17, and the price may dip to this level once again before any potential recovery begins.
On-Chain Metrics Show Mixed Signals
Despite the bearish price action, some on-chain metrics present a different picture. The Network Value to Transactions Signal (NVTS) currently sits below its May-June 2024 levels, suggesting the meme coin may be undervalued.
The exchange net position change turned negative in early June, similar to what occurred in January. This pattern could indicate accumulation as DOGE flows out of exchanges, making less Dogecoin available for selling.
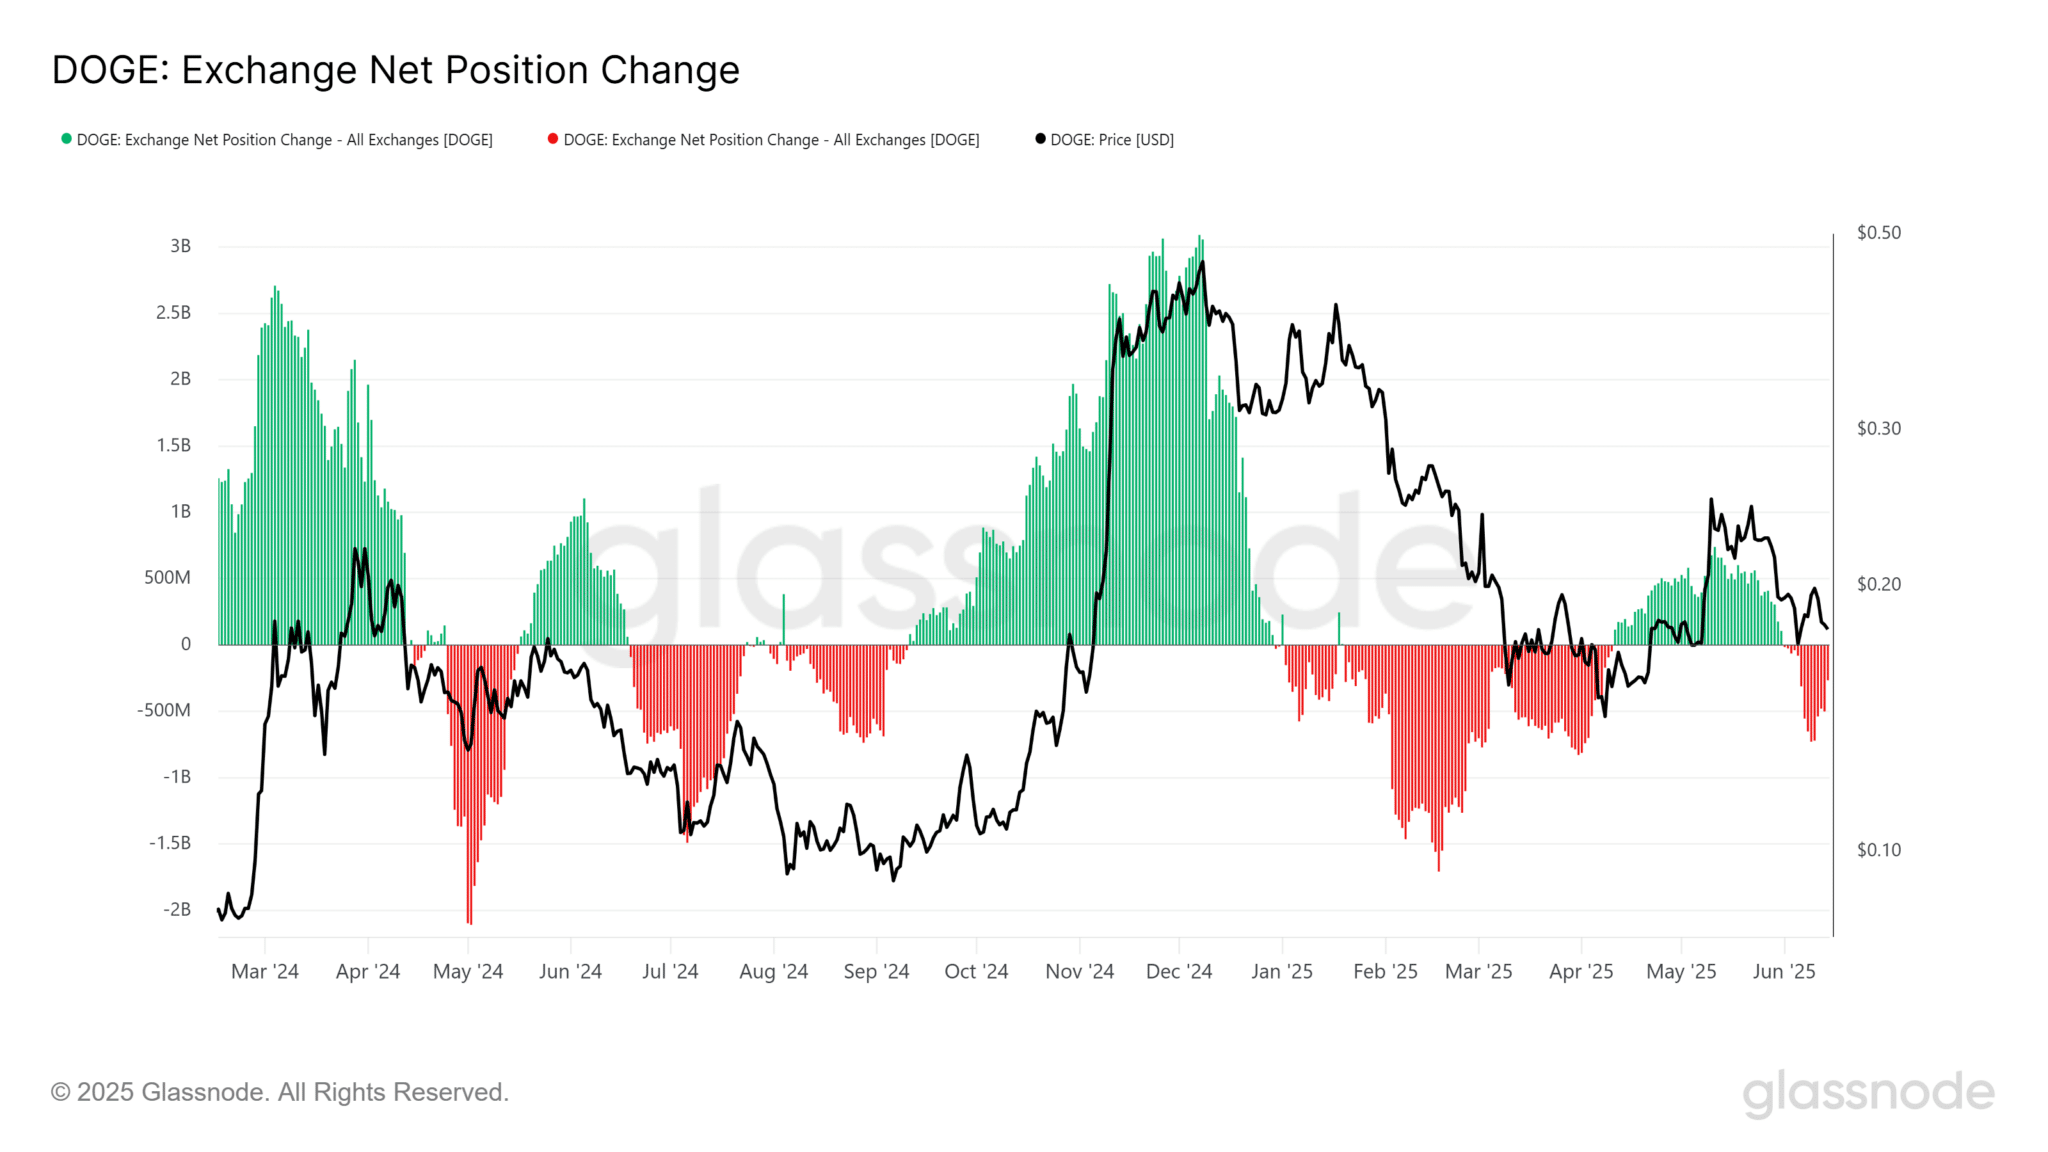
However, negative net position change does not guarantee an immediate rally. DOGE trended downward for three months despite accumulation earlier this year.
The On-Balance Volume (OBV) shows sustained selling pressure, highlighting continued seller dominance in the market.
Current technical indicators paint a mixed picture. The hourly MACD for DOGE/USD is losing momentum in the bearish zone, while the RSI sits above the 50 level.

Log in to Reply
Log in to comment your thoughtsComments
Related Articles
|Square
Get the BTCC app to start your crypto journey
Get started today Scan to join our 100M+ users