Solana Shatters Downtrend: Bull Reversal Eyes $150 as SOL Breaks Free

Solana just ripped through a critical resistance line. The technical breakdown signals a major shift—the bears are on the back foot.
The Breakout Playbook
For weeks, SOL's chart painted a classic downtrend narrative. Each rally met a wall of selling pressure, pushing prices lower in a predictable, frustrating rhythm. That pattern just snapped. The breakout wasn't a gentle nudge; it was a decisive move above a key descending trendline that had capped every attempt at recovery. This isn't just a bounce—it's a change of character.
Targets in Sight
With the downtrend invalidated, the path of least resistance points north. The immediate technical objective now sits squarely at the $150 level. That price zone represents a former support-turned-resistance area and a significant psychological hurdle. Reclaiming it would open the door to much higher territory, forcing a wholesale reassessment of Solana's near-term trajectory. Forget incremental gains; this is about recapturing lost momentum.
Market Mechanics at Work
What fuels a move like this? Look beyond the lines on a chart. It's a combination of spot accumulation—real buying demand—and a potential squeeze on over-leveraged short positions. When a market flips, it doesn't ask for permission. It just runs over anyone positioned incorrectly. The volume profile on the breakout bar tells the real story: conviction.
Of course, in crypto, every 'technical masterpiece' can be undone by a single whale's whims or a macro tweet—because sometimes the most sophisticated analysis is just guessing what a billionaire will do next. The breakout is real, but in this circus, the only constant is volatility. The bulls have the ball. Let's see if they can run it to $150 without fumbling.
TLDR
- SOL price breaks a four-month downtrend, reclaiming the $134 level on rising volume.
- Weekly structure improves as buyers defend key support near $115.
- Intraday charts favor continuation if SOL holds above $134 on a daily close.
- Clearing $144 resistance could open upside toward the $150 target zone.
Solana (SOL) price entered 2026 with renewed upside momentum after breaking a multi-month downtrend. Technical analysts highlight improving structure across several timeframes, supported by rising volume. If current levels hold, price action points toward a potential MOVE into the $144–$150 resistance zone.
Solana Price Breaks Weekly Downtrend Resistance
According to analyst Rand, the weekly Solana price chart shows a decisive break above a four-month descending resistance line. Price reclaimed the $134 area in early January after trending lower from mid-2025 highs near $200. This move marked the first sustained shift in weekly structure since the correction began.

The breakout occurred alongside improving volume conditions following the holiday period. Weekly candles suggest buyers are regaining control after defending the $115 support zone. Horizontal resistance levels remain at $144 and $150, which previously capped upside attempts.
Moreover, the weekly structure reflects resilience after prolonged consolidation. Holding above the former trendline favors continuation toward higher resistance. A loss of $134 WOULD instead expose a retest of the $120 region.
Intraday Structure Supports Continuation Above $134
Meanwhile, according to analyst Harry, the four-hour SOL perpetual futures chart shows constructive price behavior. solana price rebounded sharply from $115 and stabilized above $130, challenging the former trendline resistance. January candles indicate reduced downside volatility compared to December.
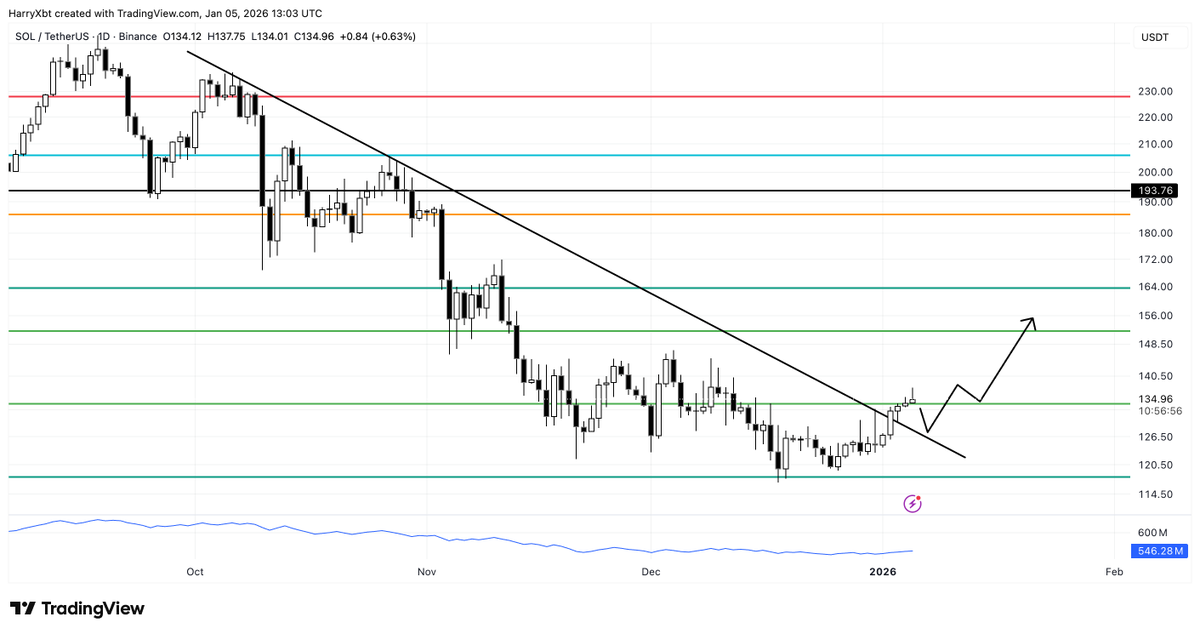
This stabilization suggests accumulation rather than reactive buying. The ability to hold above $134 on a daily close is viewed as critical confirmation. Such a close would signal acceptance above resistance and unlock higher targets.
In addition, the intraday structure reflects improving momentum conditions. If price sustains above the breakout level, a measured move toward $150 becomes feasible. Failure to maintain this zone would likely lead to renewed consolidation NEAR $125.
Falling Wedge Breakout Puts Focus on $144 Sell Wall
In addition, analyst DonnieBTC highlighted a falling wedge pattern that has guided price action since November. solana compressed within this structure after declining from $160, before rebounding toward the upper boundary. The recent test near $134 places the price at a critical decision point.
Falling wedges typically resolve higher when downside momentum fades. The chart identifies $144 as a notable sell wall that could slow upside progress. Clearing this level would confirm strength and shift focus toward the $150 region.

Furthermore, higher-timeframe alignment supports a bullish bias if resistance gives way. Sustained trade above the wedge would suggest a broader trend reversal. Rejection at resistance would delay continuation but keep the recovery structure intact.
