Ethereum Price Teeters at Critical Support - Breakdown Threat Looms

Ethereum's price action is flashing red. The digital asset is clinging to a key support level, but the grip is slipping. A decisive break below this line could trigger a cascade of selling pressure, sending ETH tumbling toward lower price zones.
The Technical Battlefield
Support levels in crypto aren't gentle suggestions—they're digital tripwires. When a major one like Ethereum's current perch fails, algorithmic traders and leveraged positions often amplify the fall. The market's watching for a clean hold or a messy breakdown.
What a Breakdown Means
A failure here isn't just a bad day. It signals a shift in market structure, potentially invalidating recent bullish setups and forcing a reassessment of short-term targets. The next support isn't always a soft landing; sometimes it's just a slower stop on the way down.
Ethereum's network fundamentals remain robust, but price has its own ruthless logic. In the end, charts don't care about roadmaps—only supply, demand, and the cold, hard bids sitting on the order book. Remember, in traditional finance they call this 'price discovery.' In crypto, we just call it Tuesday.
TLDR
- Ethereum tests key support between $2,712 and $2,788; failure to hold could signal further declines.
- Resistance at $3,154–$3,179 could limit ETH’s upside; breaking it may trigger a stronger rally.
- ETH dominance weakens as price drops; forced liquidations and risk-off sentiment increase market volatility.
- ETH faces unpredictable price action in the next 10 days as dominance breakdowns often lead to messy market rotations.
Ethereum’s price action is at a critical point. After experiencing a recent decline, the price could either break down or recover. The next few days will be crucial for determining which direction ethereum will take. Investors are closely watching key levels to see whether Ethereum can maintain support or continue its downward movement.
Ethereum Trading Within a Well-Defined Trend Channel
Ethereum has been following a downward trend within a clearly defined channel. The price has formed multiple highs and lows, making the trend structure more noticeable. As the channel becomes more apparent, its effectiveness as support or resistance could weaken. This happens because more traders are now aware of these levels, which may reduce their impact.
Currently, Ethereum is testing a crucial support zone between $2,712 and $2,788. This range is also aligned with the midline of the trend channel, adding to its importance. If Ethereum holds above this level, it could signal that buyers are stepping in. A bounce from this support zone could indicate a potential short-term recovery.
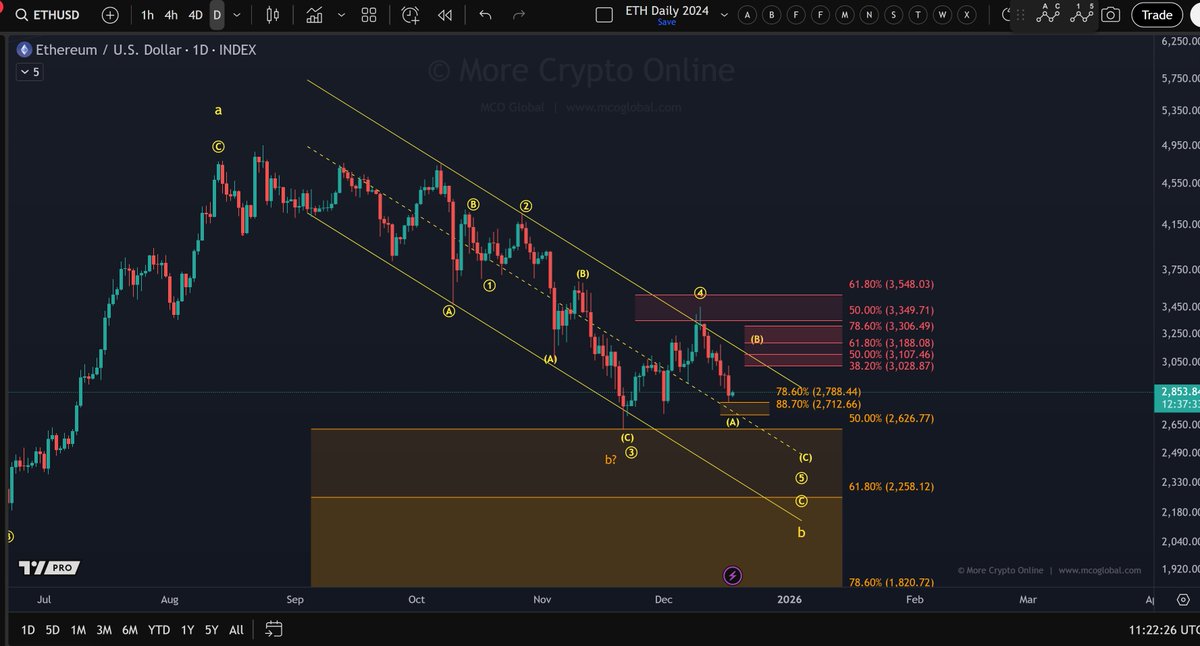
However, given Ethereum’s recent drop of nearly 20%, a rebound is not guaranteed. The price could continue to decline before any significant reversal. Although a short-term bounce is possible, traders should remain cautious for any signs of weakness. The support zone is critical and will determine whether the price stays within the channel or breaks out.
Resistance Levels Could Limit Ethereum’s Upside
Ethereum faces strong resistance in the NEAR term, which could limit its upside. The key resistance zone lies between $3,154 and $3,179, where significant accumulation has occurred. Many holders in this range may look to sell, which could put downward pressure on the price. Ethereum will struggle to rise above this zone without significant buying interest.
Another resistance level around $3,149 further complicates matters. If Ethereum fails to break above this price point, any pontential rally will likely be short-lived. A break above this level WOULD be a bullish sign, confirming a shift in momentum. Until then, Ethereum’s upside may remain capped, and the price could consolidate.
Despite the potential for a rebound, Ethereum must overcome these resistance levels to see a more substantial MOVE upward. If the price is unable to break through, it may face more sideways action. On the other hand, a clean break above these resistance zones could trigger a stronger rally, leading to higher price levels.
ETH Dominance Faces Increased Risk
ETH.D has struggled to maintain support at the 50-SMA and is now at risk of losing the 100-SMA and trendline. If these levels fail to hold, the price could drop back into the black box retest zone. This breakdown would signal further weakness, with ETH dominance likely declining. Additionally, ETH has also lost the 50-RSI on the oscillator, which adds to the growing list of bearish signals.
The current market environment only strengthens the bearish outlook for ETH. Yesterday, the crypto market saw significant forced liquidations, with BTC dropping approximately 4.6% and ETH falling around 6.9%. These sharp declines reflect the increasing volatility and a risk-off sentiment that is pressuring the market. As ETH dominance weakens, capital may rotate out of ETH and into other assets, diminishing ETH’s performance.
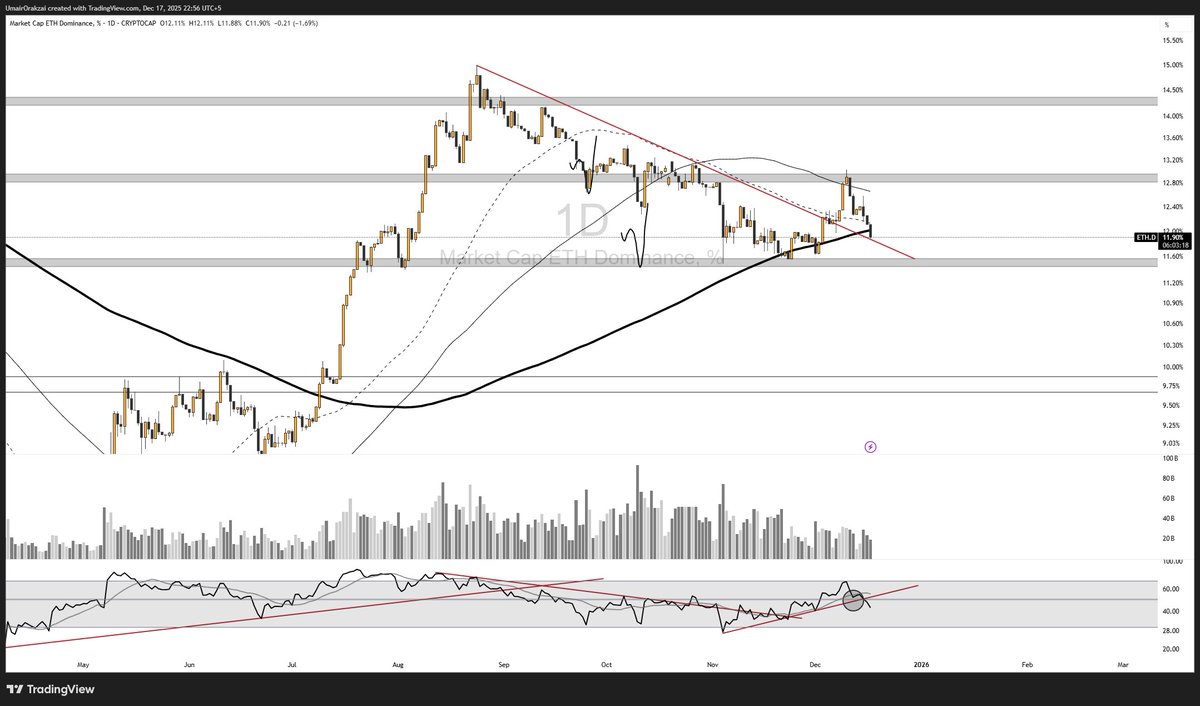
Looking ahead, the next 10 days are expected to bring unpredictable price action. Dominance breakdowns like this often lead to messy rotations and erratic movements within both the ETH and altcoin markets. Traders should brace for volatility as these market shifts unfold, making it difficult to forecast the next moves for ETH and other cryptocurrencies.
