XRP Price: ETF Inflows Hit $1 Billion as Chart Patterns Signal Potential Rally

Institutional money floods in as technicals align for a potential breakout.
The Billion-Dollar Bet
A staggering $1 billion has poured into XRP-related exchange-traded funds, marking a seismic shift in institutional sentiment. This isn't just speculative retail chatter; it's cold, hard capital voting with its wallet. The move suggests major players are positioning themselves ahead of what they see as a pivotal moment for the digital asset, betting that the regulatory clouds are finally parting.
Reading the Charts
On the technical front, classic chart patterns are flashing bullish signals. Analysts point to formations that historically precede significant price rallies, suggesting the recent consolidation phase may be a coiled spring. The convergence of massive capital inflows with these technical indicators creates a potent, if not guaranteed, recipe for upward momentum. It's the kind of alignment that gets traders' attention—a fundamental catalyst meeting a technical trigger.
The Cynical Take
Of course, on Wall Street, a billion dollars is often just the cost of admission to lose two billion later—a reminder that in finance, today's sure thing is tomorrow's footnote. Yet, for XRP, this institutional endorsement cuts through the usual noise, bypassing years of regulatory uncertainty to place a direct bet on its future utility. The market is watching to see if this is the start of a major re-rating or just another expensive lesson in timing.
TLDR
- XRP price currently trades at $1.86, down from its peak of $3.65 in July, but technical patterns suggest a potential rebound to $3
- Spot XRP ETFs have reached $1 billion in total inflows just one month after launch, with daily inflows of $8.54 million reported recently
- XRP ETFs have never experienced a day without inflows, while Bitcoin and Ethereum ETFs have seen outflows of $277 million and $500 million respectively
- The coin has formed an inverted head-and-shoulders pattern and a double-bottom pattern at $1.81, both considered bullish technical indicators
- JPMorgan predicts XRP ETFs could attract $6-8 billion in their first year, suggesting continued institutional interest despite current price weakness
XRP price has dropped 1.2% to trade at $1.86, continuing a downward trend that began in July when the token reached $3.65. The decline has pushed the coin below all major moving averages.

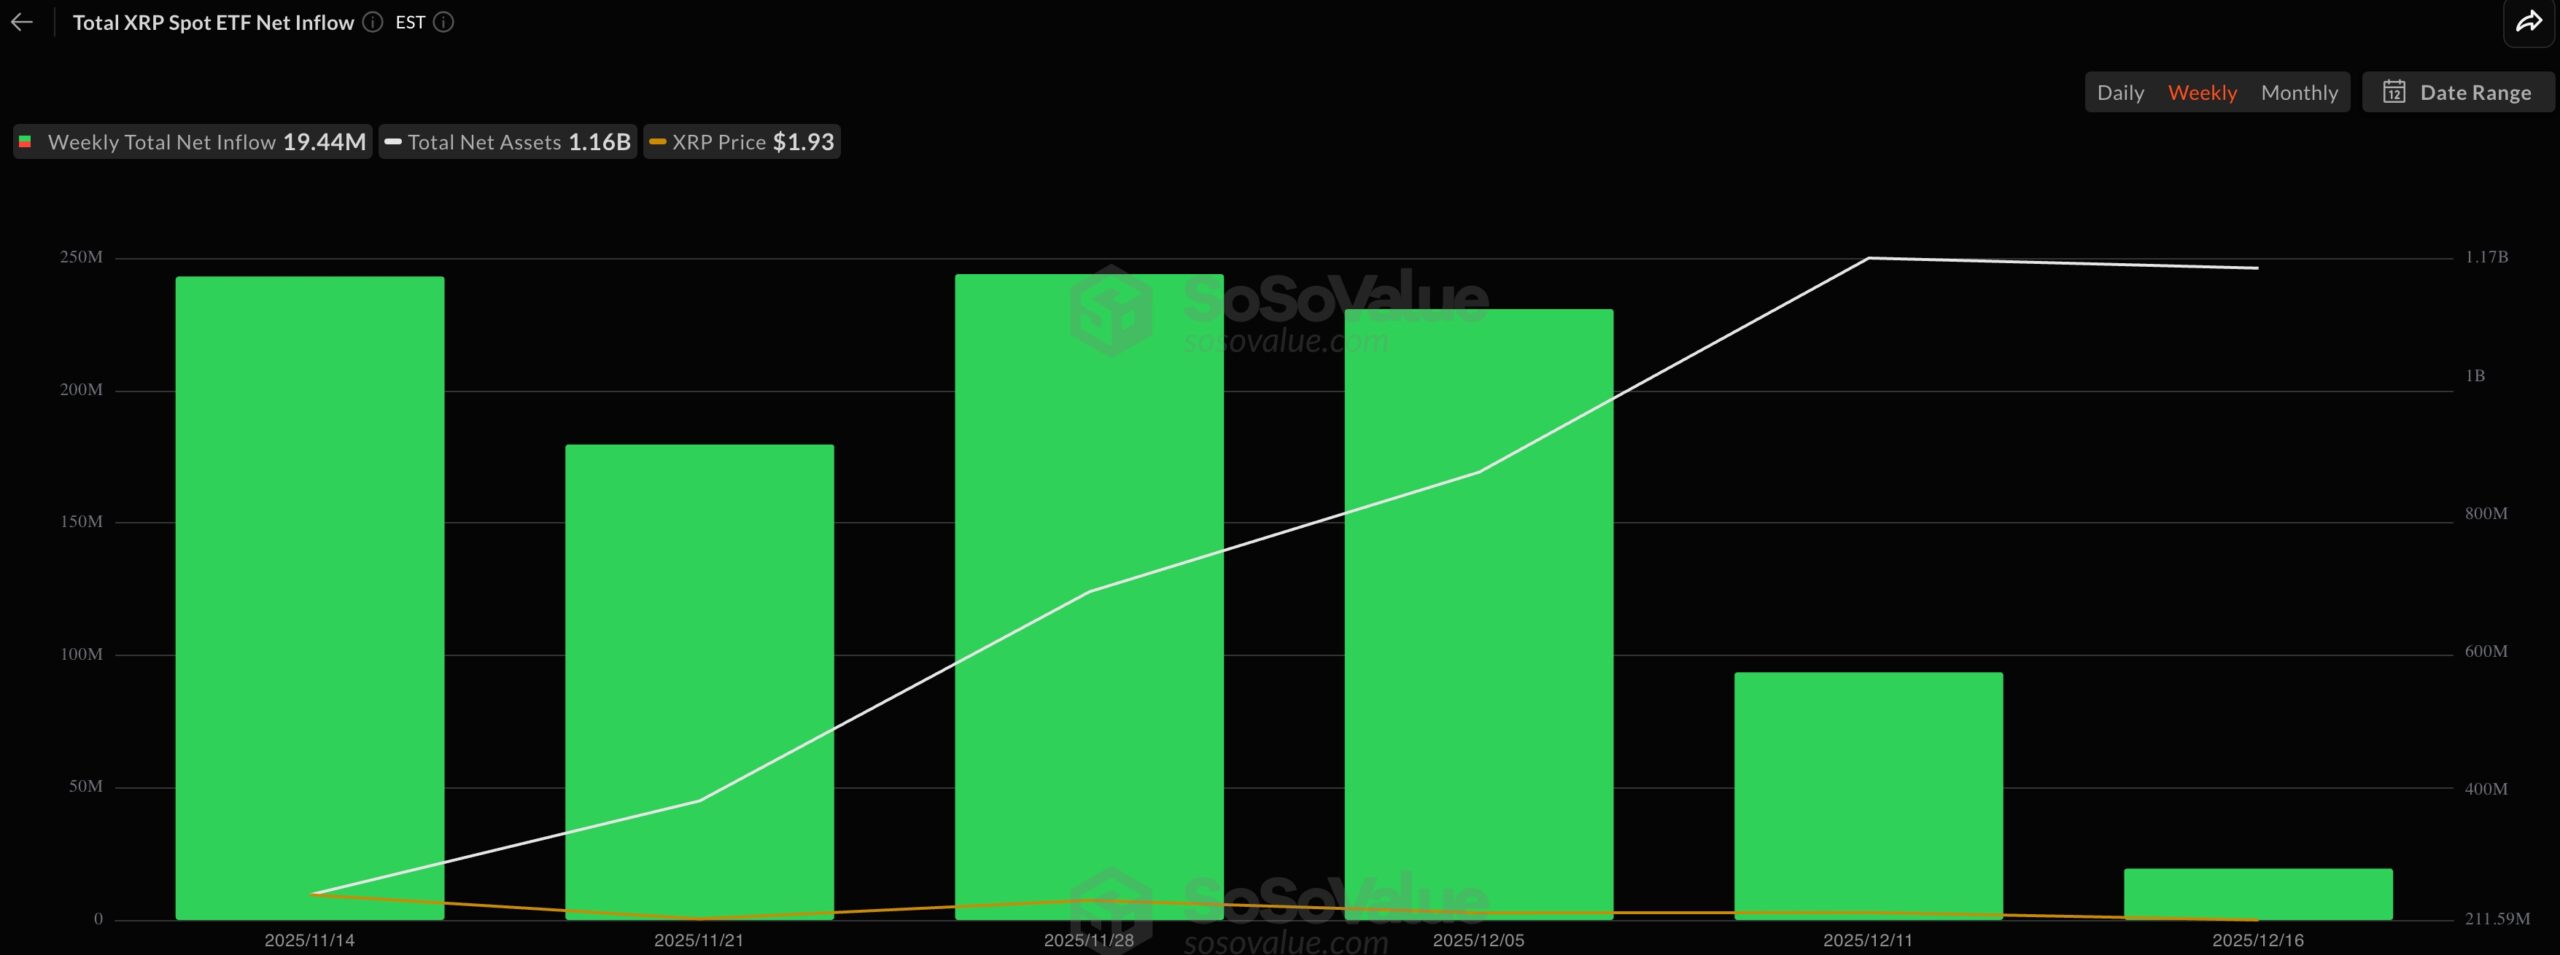
Despite the price weakness, institutional interest in XRP remains strong. Spot XRP exchange-traded products launched last month have attracted $1.16 billion in total assets under management.
Recent data shows XRP ETPs recorded $8.54 million in net inflows. The funds have maintained positive inflows every single day since launch. The worst performance came on November 18 with $8.2 million in inflows.
The $1 billion milestone stands out when compared to ethereum ETFs, which took over a month to reach the same amount. This marks XRP as one of the fastest-growing ETF products in the crypto space.
ETF Flow Patterns Show Rotation
The steady inflows into XRP products come as Bitcoin and Ethereum ETFs experience outflows. Spot Bitcoin ETFs saw $277 million leave on Tuesday, following $357 million in outflows the previous day.
Ethereum ETFs have lost over $500 million in assets over four days. Total net inflows for Ethereum products now stand at $12.6 billion, down from nearly $15 billion at their peak.
JPMorgan analysts predict XRP ETFs will attract between $6 billion and $8 billion in their first year. If current trends continue, the funds may exceed these projections.
Technical Setup Points to Upside
XRP has formed two bullish chart patterns on the daily timeframe. The first is an inverted head-and-shoulders pattern with a neckline connecting the highest points since October 2.
BREAKING:![]() $XRP WEEKLY RSI HITS 33!
$XRP WEEKLY RSI HITS 33!
Could See A LARGE Bounce From These Ranges… pic.twitter.com/HbCFBaZdKR
— Good Evening crypto (@AbsGMCrypto) December 18, 2025
The coin is currently in the right shoulder phase of this formation. The second pattern is a double-bottom at $1.81, a level that has held as support multiple times.
The Relative Strength Index and Percentage Price Oscillator both point downward. On-Balance Volume shows declining buying pressure. These indicators suggest the coin remains in consolidation.
The technical setup targets a move to $3 if the patterns play out. This represents a 57% gain from current levels. The bullish forecast WOULD fail if price breaks below the $1.81 support level.
Flow data from Coinglass shows positive net inflows occurred during November and early December. These inflows happened as price declined, creating a divergence pattern. This typically indicates institutions are buying during price corrections.
XRP trades between $1.85 and $1.90, establishing a support zone. The coin needs to hold above this range and show momentum indicators turning positive before attempting a stronger MOVE higher.
