Bitcoin Bulls Target $94K-$120K: Major Breakouts Signal Historic Rally

Bitcoin's chart just flashed a signal that's got bulls loading up—and their sights are set on a staggering $94,000 to $120,000 price target.
Why the surge in confidence? A major technical breakout is underway. Analysts point to a decisive move above a critical resistance level that has capped price action for months. This isn't just a minor pump; it's the kind of structural shift that precedes parabolic runs.
The Path to Six Figures
The roadmap hinges on holding newfound support. If Bitcoin can consolidate above the breakout zone, the next leg up could be swift. The $94,000 target represents the first major Fibonacci extension level, while $120,000 sits at a confluence of historical and technical projections. It’s a bold call in a market known for humbling the overconfident—just ask any crypto fund manager who tried to time the top last cycle.
Momentum is building, liquidity is following, and the fear of missing out is creeping back into trader chats. This setup suggests we're not just looking at a rally, but a potential redefinition of Bitcoin's valuation floor. Of course, in crypto, the only thing more predictable than a breakout is a sudden, gut-wrenching correction that wipes out leveraged positions faster than you can say 'risk management.'
TLDR
- Bitcoin holds $85K support as selling pressure shows signs of absorption
- Falling wedge on lower timeframes hints at a bullish breakout setup
- $94K–$98K remains the key resistance zone to reclaim
- Higher-timeframe trend stays bullish as long as $79K–$86K support holds
Bitcoin price is consolidating after a sharp correction from its 2025 all-time highs, with traders closely watching key support and resistance zones. Technical analysts point to strong defense NEAR $85,000, while longer-term charts continue to reflect a bullish structure. Together, short-term compression and macro trend support suggest that the market is approaching a decisive phase that could define Bitcoin’s next major move.
Bitcoin Price Defends $85K Level
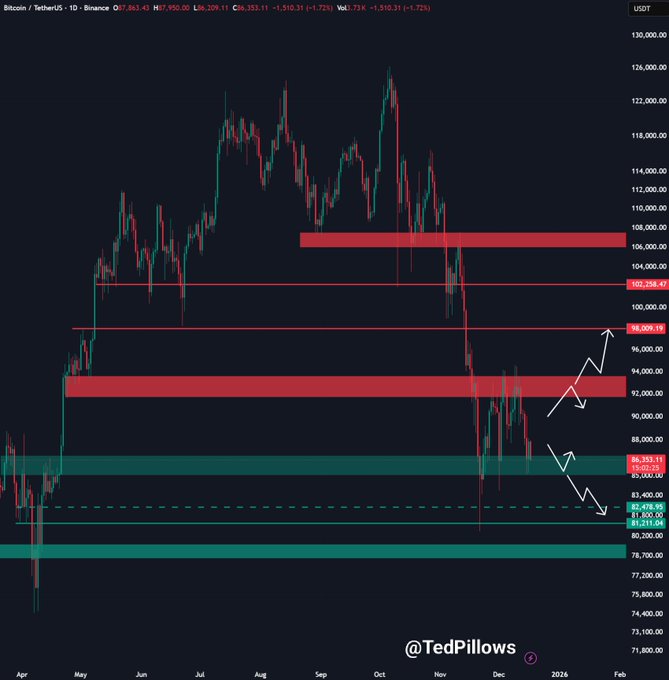
According to analyst Ted, the daily BTC against USD chart shows an ongoing struggle between buyers and sellers following the rejection above $126,000. Price has pulled back sharply but continues to respect the broad support zone around $85,000, an area aligned with prior breakout levels and high historical volume. Multiple tests of this region have produced higher lows, indicating absorption of selling pressure rather than aggressive distribution.
SOURCE: X
At the same time, overhead resistance remains well-defined. The $88,000–$89,000 level acts as an initial reclaim zone, while stronger supply is clustered between $94,000 and $98,000. Ted noted that a sustained move back above $88,000 could trigger a relief rally toward $94,000. Conversely, a decisive loss of the $85,000 base would likely expose Bitcoin to a deeper retracement toward November’s lows, making this zone pivotal for near-term direction.
Macro Uptrend Remains Intact on Higher Timeframes
Meanwhile, a multi-year perspective shared by analyst Hardy places recent volatility within a bullish context. The weekly and monthly charts show bitcoin continuing to respect an ascending trendline that has guided price action since late 2023. Despite the drawdown from cycle highs, higher lows remain intact, and the current consolidation represents a modest pullback within a larger bull channel.
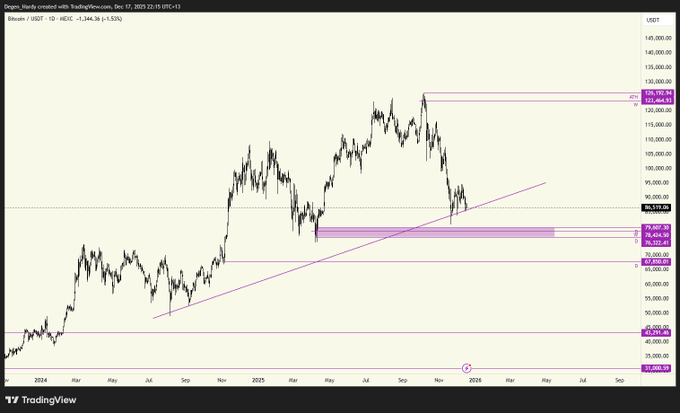
In addition, the $79,000–$86,000 range has repeatedly flipped from resistance into support during the current cycle. Price is now compressing near the lower boundary of this zone, while momentum indicators have cooled from overbought conditions. Hardy highlights that similar pauses occurred in previous cycles before strong upside expansions, suggesting the long-term structure still favors continuation as long as the trendline holds.
Falling Wedge Signals Potential Breakout Setup
From a shorter-term perspective, Captain Faibik identified a developing falling wedge on the 8-hour chart. Price has been compressing against a descending trendline while forming higher lows, a structure often associated with bullish reversals. The tightening range reflects declining sell-side pressure, with volume diminishing on successive tests of resistance.
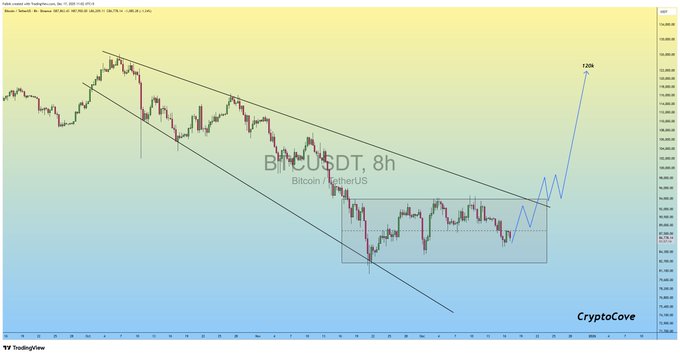
Furthermore, current price action sits just below the trendline near the mid-$80,000 region. A confirmed 8-hour close above this level could act as a catalyst for accelerated upside. Based on the wedge’s measured move, the analyst projects a potential rally toward $120,000 if a breakout materializes. This target aligns with broader bullish scenarios outlined on higher timeframes, reinforcing the technical case for an upside resolution.
Bitcoin remains at a technical crossroads, with critical levels converging across multiple timeframes. Strong support defense, intact macro structure, and short-term compression suggest that volatility may soon expand. A confirmed reclaim of resistance could shift momentum decisively higher, while failure at support WOULD delay bullish scenarios. For now, market participants continue to monitor these zones closely as Bitcoin approaches its next
