XRP Price Prediction: Bulls Dig In at Critical Support as Triangle Breakout Showdown Approaches

XRP bulls mount fierce defense at make-or-break level
Technical Tension Builds
The symmetrical triangle pattern tightening around XRP threatens explosive movement. Traders watch every candle as support tests intensify. No fancy indicators needed—just pure price action drama unfolding in real time.
Breakout Imminent
Volume patterns suggest accumulating pressure. Either bulls catapult prices upward or bears force a breakdown. The chart doesn't lie—it's consolidation warfare with massive directional consequences.
Market Stakes
Another day, another 'critical level' in crypto—because apparently traditional finance metrics are too boring for this circus. But when XRP moves, it really moves. Get ready for volatility that'd give any hedge fund manager heart palpitations.
TLDR
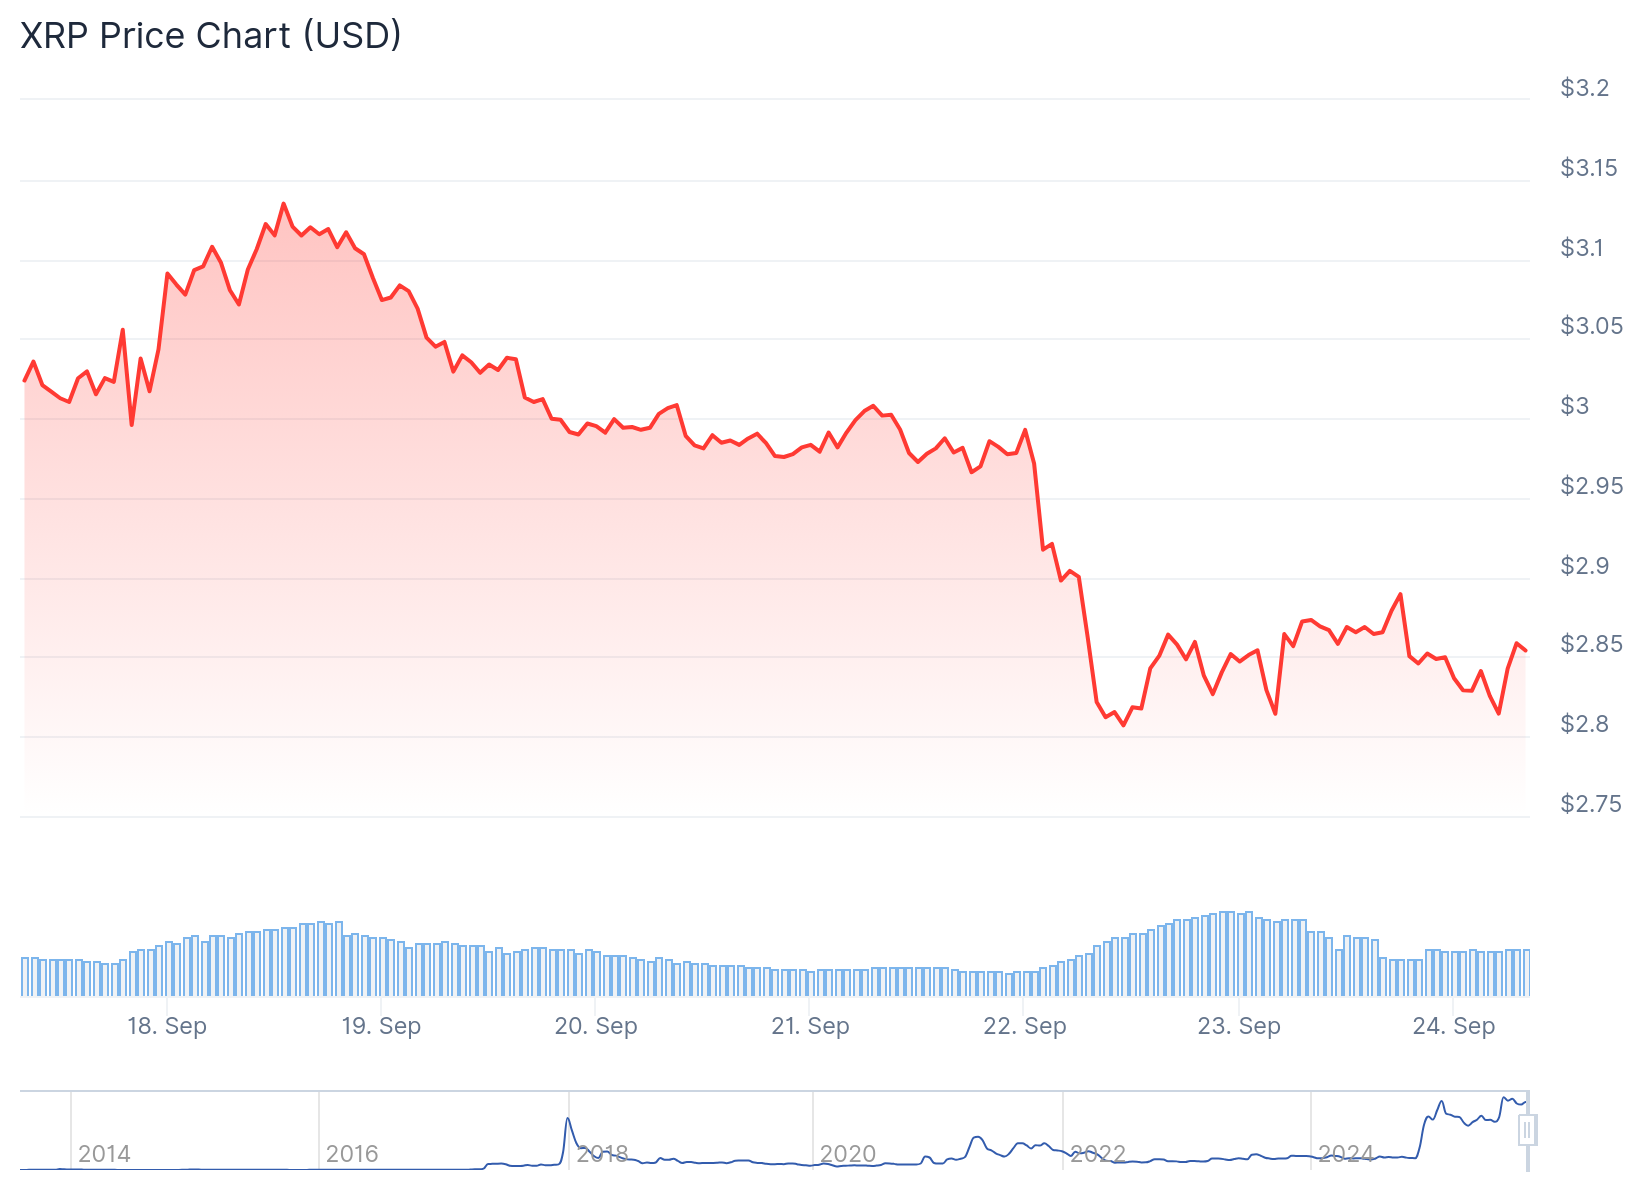
- XRP trades around $2.88 with bulls defending the $2.70-$2.80 support zone
- Triangle pattern completion could trigger a move toward $4.20 target
- Recent decline below $2.90 shows bearish pressure with risk of further drops
- Key resistance sits at $2.90 level with support at $2.780
- Technical indicators show mixed signals as price approaches decision point
XRP trades around $2.88 as the token faces a critical technical juncture. The price has been trapped in a symmetrical triangle formation for several weeks.
Buyers continue to step in around the $2.70-$2.80 zone. This area has created a solid foundation for potential upward movement.
The token recently declined below the $2.90 support zone. Bears pushed the price down to a low NEAR $2.678 before a recovery attempt began.
XRP now trades below $2.90 and the 100-hourly Simple Moving Average. A bearish trend line has formed with resistance at the $2.90 level.
The technical picture shows clear support levels holding firm multiple times. Meanwhile, a descending resistance line caps rallies, creating the classic triangle formation.
Chart Analysis Points to Key Levels
If XRP breaks through resistance, the first target sits around $3.50. The real prize target is $4.20 based on the triangle’s measured MOVE projection.
I hope you are ready for the next leg up!?
Leave a like if your #XRP bags are packed! pic.twitter.com/4WX93fTc8j
— JackTheRippler ©️ (@RippleXrpie) September 23, 2025
On the upside, the price faces resistance near the $2.880 level. The first major resistance sits at $2.90 and the trend line.
This level aligns with the 50% Fibonacci retracement of the recent decline. A clear move above $2.90 resistance might send the price toward $2.950.
Any gains beyond that could push the price toward the $3.00 resistance level. The next major hurdle for bulls sits near $3.120.
Downside Risks Remain Present
If XRP fails to clear the $2.90 resistance zone, further declines could follow. Initial support on the downside sits near the $2.780 level.
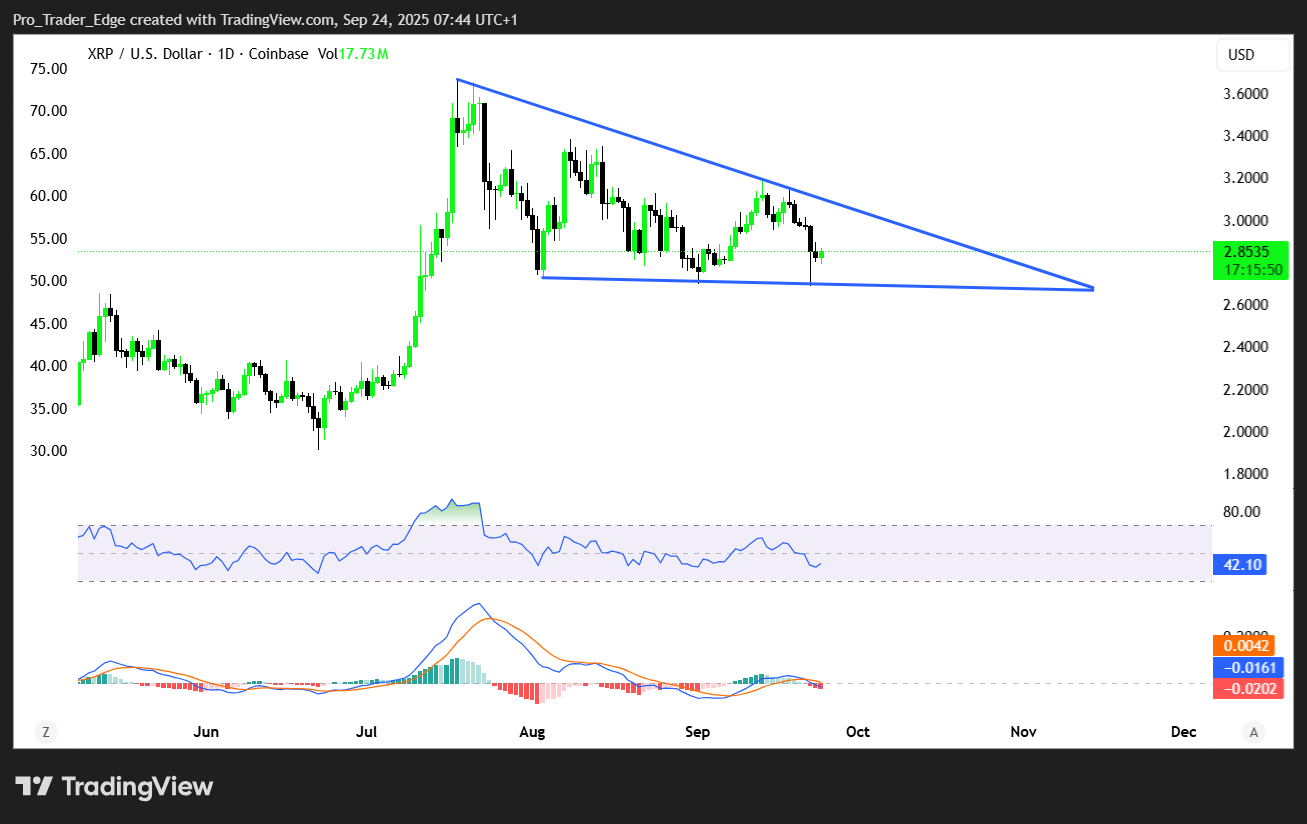
The next major support level is near $2.7150. A downside break and close below this level could trigger continued decline toward $2.650.
The hourly MACD for XRP/USD is gaining pace in the bearish zone. The RSI now sits below the 50 level, showing bearish momentum.
Three main drivers could push XRP higher in coming sessions. Ripple’s ongoing institutional push through central bank digital currencies continues gaining traction.
Cross-border payment solutions remain a key focus for the company. The broader crypto market sentiment shows signs of improvement.
On-chain activity has been picking up recently. Transaction volumes support the potential bullish narrative for the token.
The current price action suggests a decisive moment approaches. Either direction could see substantial movement in the near term.
