Bitcoin Bollinger Bands Flash Warning: Brace for Major Volatility Surge

Bitcoin's technical indicators scream volatility—Bollinger Bands tightening like a coiled spring.
Market on Edge
Traders watch bands compress—historically a precursor to explosive price moves. No crystal balls here, just mathematical probabilities screaming 'buckle up.'
Technical Breakdown
Band contraction signals dwindling volatility—often followed by massive breakouts. Markets hate uncertainty almost as much as traditional bankers hate decentralization.
Timing the Storm
Previous squeezes preceded 30%+ swings within weeks. Current setup mirrors past volatility explosions—perfect storm for bulls and bears alike.
Trader's Dilemma
Position sizing becomes critical when bands expand—ride the wave or get wiped out. Professional desks increase hedging while retail FOMO kicks in—classic market cycle playing out.
Volatility breeds opportunity—and catastrophic losses. Whether this pumps portfolios or wrecks leverage traders remains seen, but one thing's certain: traditional finance will still blame crypto while missing yet another paradigm shift.
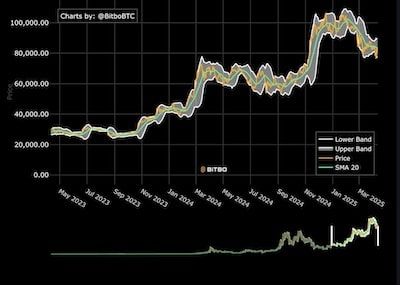
Extreme compression observed
Trader Matthew Hyland highlighted that the Bollinger Bands are at their narrowest on the monthly chart, a phenomenon echoed by analyst crypto Caesar, who stated:
“The Bitcoin Bollinger Bands on the 1M (monthly) are at historical tightness. This has previously led to heavy volatility to the upside. Bitcoin could be in for a spicy Q4.”
Historical episodes of such compression in 2012, 2016, and 2020 were followed by sharp upward price moves, as noted by investor Giannis Andreou, who warned of “huge volatility ahead.”
Cup-and-handle pattern points to $300K
Technical analysts are also watching a large cup-and-handle formation on the monthly chart, with the breakout neckline at $69,000 cleared in November 2024.
This classical chart pattern projects a price target of approximately $305,000 for bitcoin in the 2025–2026 period, representing over 170% upside from current levels. H
owever, studies suggest only about 61% of such patterns reach their full target.
Institutional demand and ETF flows
Persistent demand from spot Bitcoin ETFs and public treasury companies is supporting bullish sentiment.
Recent inflows have accelerated, as noted by analytics firm Santiment:
“Money is moving back into Bitcoin ETFs at a rapid rate as retailers impatiently drop out of bitcoin. Previous bitcoin rallies were boosted by inflow spikes like this.”
