PEPE Soars 45%—Can the Memecoin Crack $0.00001550?

Another day, another memecoin moon mission. PEPE’s price just ripped 45%—now traders are eyeing that $0.00001550 level like it’s the last lifeboat off the Titanic.
The Pump Nobody Predicted
No white paper? No problem. PEPE’s rally defies logic—just like the ‘fundamentals’ of most crypto projects. Liquidity floods in, charts go vertical, and suddenly everyone’s a ‘long-term holder.’
The Gravity-Defying Target
$0.00001550 isn’t just a number—it’s the line between ‘degenerate gamble’ and ‘visionary trade.’ Break it, and the FOMO could get ridiculous. Fail, and well… at least the memes were funny.
Wall Street’s still arguing about P/E ratios while frog-themed tokens eat their lunch. Never change, crypto.
Will PEPE Coin Breakout Spark Another Meme Coin Bull Rally?

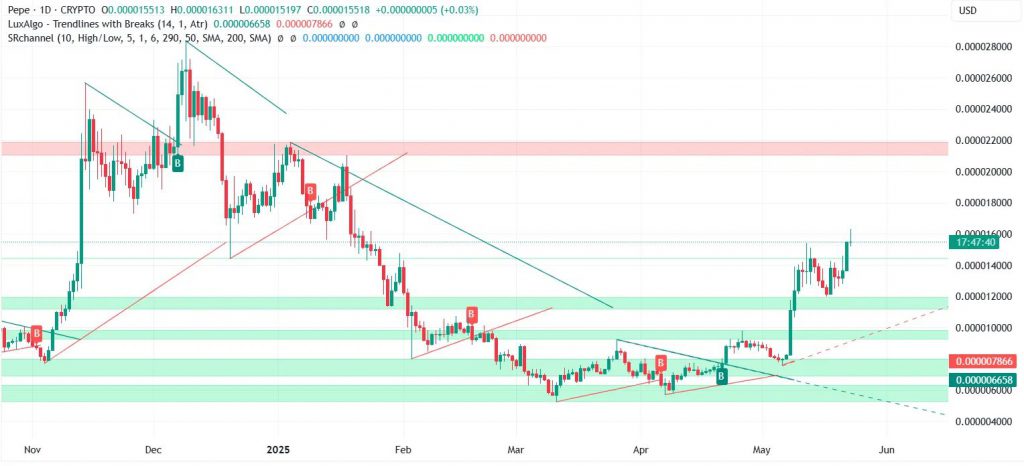
The recent PEPE price prediction scenario shows quite an impressive clean reversal from multi-month lows. The token has successfully broken past both the 23.6% and also the 38.2% Fibonacci retracement levels, which is really quite bullish for PEPE. The meme coin rally has also reclaimed that important psychological $0.00001200 mark, and this area previously acted as support before the February selloff happened.
The breakout from the $0.00001020–$0.00001200 range has been backed by rising volume, and this suggests bulls are attempting quite a big reversal move. At the time of writing, the Pepe coin is climbing toward the 50% retracement zone near $0.00001800, which represents good upside potential for the token.
The structure has been solid, and traders are noting that speculative capital has moved back into high-risk assets like PEPE crypto. This shift happened following Bitcoin’s move above $110K, and it’s providing extra support for the meme token ecosystem right now.
Daily Timeframe Shows Exhaustion Warning Signs
On the daily chart, as revealed by CoinGecko, PEPE’s price spikes accelerated after clearing quite an impressive falling wedge formation, and the token successfully retested support zones NEAR $0.00001050. However, the current candle shows quite an obvious long upper wick, and this suggests intraday selling pressure around the $0.00001600 level.
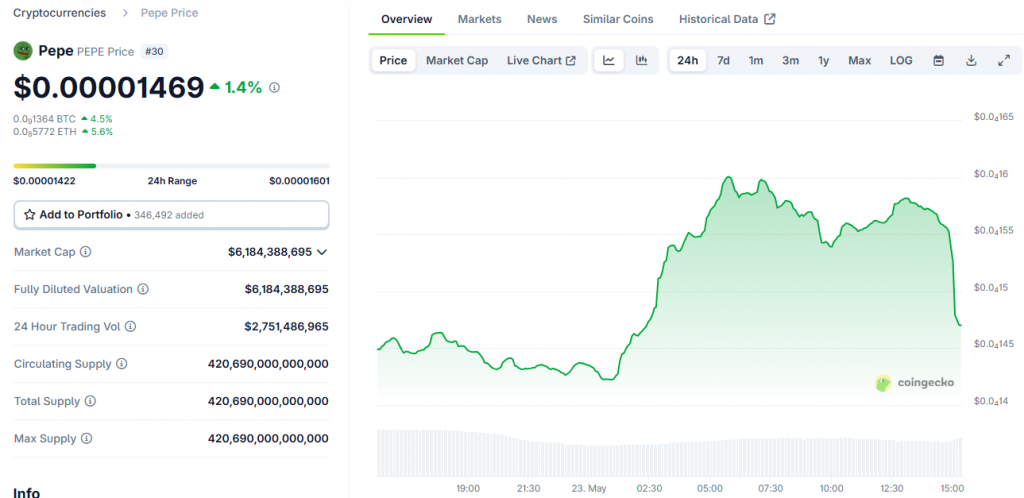
The RSI is approaching overbought territory near 68.7 right now, and the MACD histogram remains elevated but is beginning to flatten. This early sign indicates that the vertical push may be cooling off in this crypto market update, and bulls need to defend the $0.00001400–$0.00001450 area for this pepe price prediction to materialize.
Key Levels Define Short-Term Price Action
Right now, the key near-term support for this Pepe Price prediction sits around $0.00001430–$0.00001450, and further demand is expected near $0.00001370. A breakdown below $0.00001320 would trigger broader liquidation, and this would drag the price back toward the $0.00001260 area.
On the upside, bulls must overcome resistance at $0.00001590, and then aim for the next key level near $0.00001750. Beyond that level, the 50% Fibonacci retracement at $0.00001800 remains the next major upside target for this meme coin rally scenario.
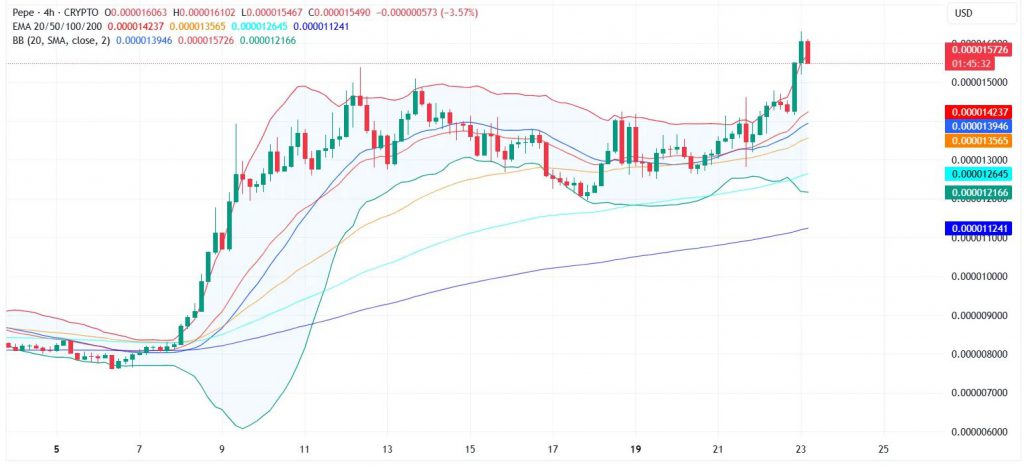
The current meme coin rally momentum remains intact for now, but lower-timeframe indicators are flashing caution signs. The PEPE coin has reclaimed its 50 and also the 100 EMA clusters on the 4-hour chart, and the surge above $0.00001350 invalidated the descending channel structure quite decisively.
Until PEPE breaks cleanly above $0.00001600 with volume confirmation, traders can expect tight-range consolidation and volatility. The PEPE crypto ecosystem continues to benefit from speculative capital rotation, though this crypto market update suggests bulls must tread carefully in the near term as momentum indicators show mixed signals across timeframes.
