SHIB Primed for 100% Surge—Analysts Flag $0.00003 Target After Breakout

Dogecoin’s scrappy cousin just got a bullish upgrade. SHIB shatters resistance—now eyeing a moonshot to double its current value.
Why the frenzy? Technicals scream breakout. The meme coin’s chart paints a textbook bullish pattern, and traders are piling in like it’s 2021 all over again. ’This isn’t just hype—it’s a structural move,’ claims one analyst who probably missed the last three market crashes.
But here’s the kicker: hitting $0.00003 would require SHIB to dodge the gravitational pull of reality—and a crypto market that eats ’sure things’ for breakfast. Buckle up.
Shiba Inu Price Breakout Analysis: Rally to $0.00003 Predicted
Critical Trendlines Breached
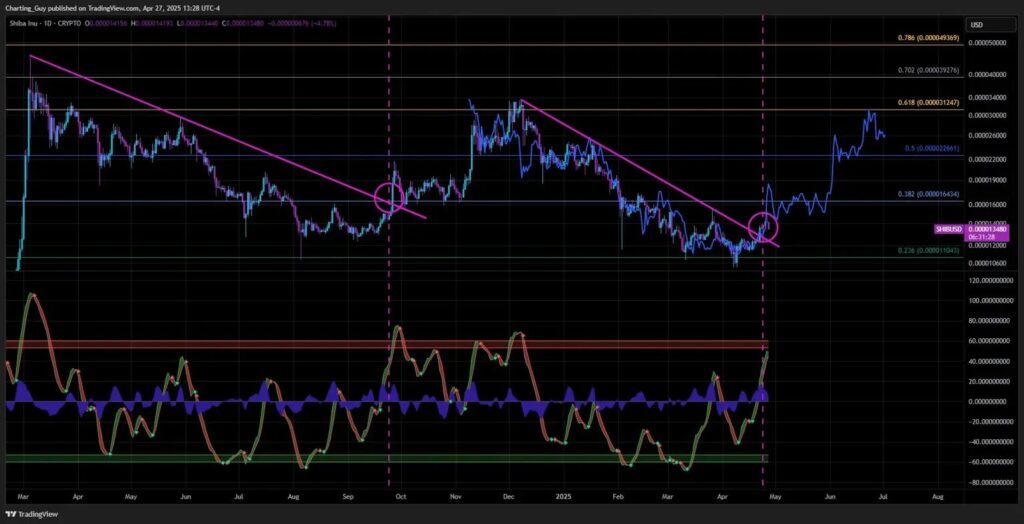
The latest Shiba Inu price breakout analysis reveals that the token has actually overcome two major descending trendlines that have dominated its price action throughout 2024 and also the early part of 2025. The first major downtrend really began back in March 2024, creating a series of lower highs and lower lows until SHIB finally broke above this trendline in late 2024, which triggered a nice spike up to $0.000031.
Charting Guy stated on his X profile:
$SHIB update
this aligns better. https://t.co/GvXxIEQpx1 pic.twitter.com/Rn4Y89YFIg
Following this initial breakout, another descending trendline formed as selling pressure continued into 2025. In mid-April 2025, SHIB managed to breach this second resistance, and this could potentially be shifting the market dynamics. Previous attempts at around $0.000026 and just below $0.000016 unfortunately failed due to insufficient bullish momentum at those times.
Bullish Indicator Signals
The technical analysis for Shiba Inu currently shows the WaveTrend Oscillator turning upward after reaching some pretty oversold territory below 60. Historically, these kinds of movements have preceded sustained SHIB rallies, which provides additional confirmation for the current setup that traders are looking at.
A weekly SHIB/USD chart analysis actually reveals three key indicators that are showing early bullish reversal patterns: the RSI, WaveTrend Oscillator, and also the LMACD. The RSI has sort of flattened around the 40-45 range after a rather prolonged decline, creating conditions that are generally favorable for upward movement once momentum really starts to build.
When analyzing the weekly timeframe, Charting Guy explained:
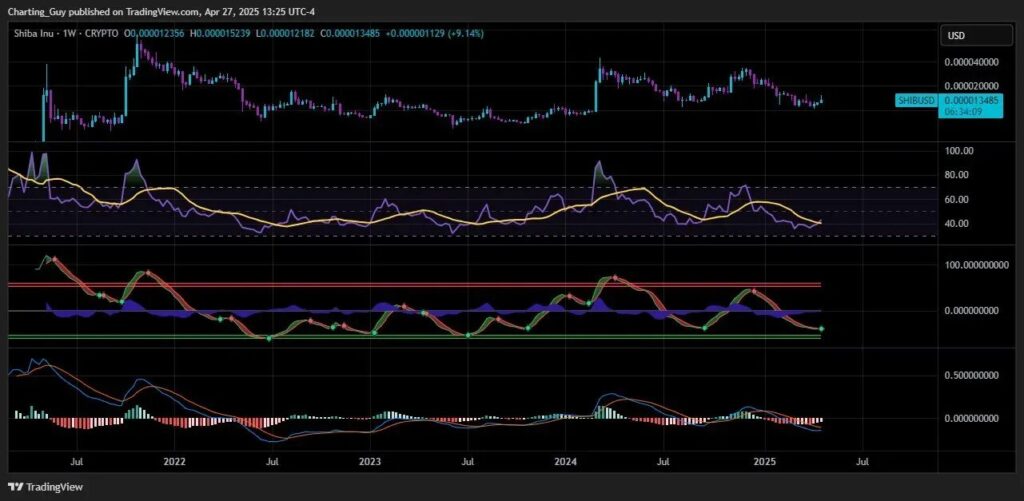
Both oscillating lines are approaching what looks like a positive crossover, with histogram bars shifting from negative to more of a neutral position. Previous green dots that appeared on the weekly chart have preceded multi-week price expansions for SHIB, so this is definitely something to watch right now.
Additional Analyst Perspectives
The Shiba Inu price breakout thesis extends beyond just a single analyst at this point. In his recent commentary, analyst SABoikie stated:
Based on his analysis there exists a fractal pattern that indicates SHIB could rise above $0.000014 as its first milestone although future targets may extend beyond $0.00010. According to MMB Trader the established baseline support level at $0.00001 could make a target price of $0.000037 seems achievable for this popular meme token.
The previous Fibonacci retracement zone measured at 0.618 last appeared in December 2024 and serves today as a vital upper target for $0.00003. Fibonacci analysis demonstrates its critical nature at this level because major market reversals tend to happen at these mathematical ratios which traders actively watch.
The momentous breakout from a trendline indicates that Shiba Inu crypto could push past previous defense points.
The bullish SHIB rally forecast has become more likely because retail investors show growing interest while multiple technical indicators confirm a bullish outlook for the coming weeks. Market evaluation of recent technical developments might establish whether SHIB can achieve its 100% price rally to $0.00003 during the coming weeks. This price target supports the Shiba Inu price breakout pattern noted by multiple analysts.
