US Core PPI falls to 3.4% – Lower Than Expectations

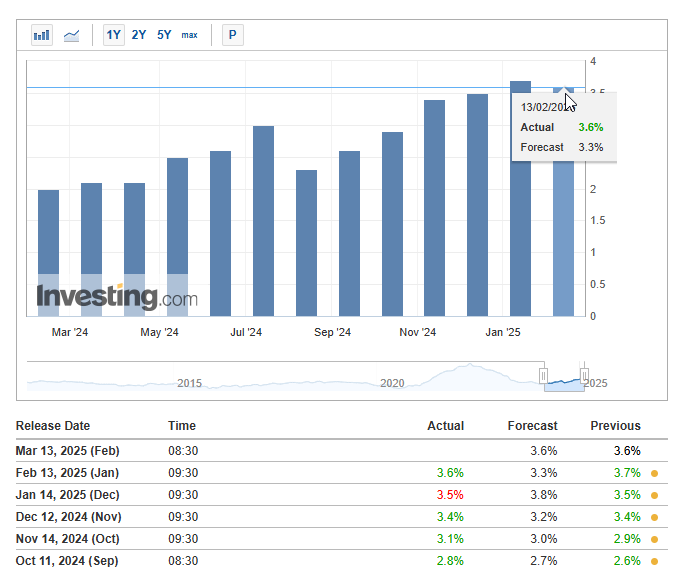
The CORE PPI inflation data, at the time of writing, showed a 0.3% rise in January, and also that there were some key indicators pointing to sustained pressure. The PPI report revealed year-over-year figures at a value of 3.6%, positioning above the forecast of 3.3% across economic sectors. This represents a modest drop from a value of 3.7% back in December, but continues to show some persistent inflation pressure in the economic calendar for early 2025. What do you think this means for your investments? Let’s find out!
JUST IN: US Core PPI falls to 3.4%, lower than expectations.
Analyzing Core PPI Trends and Their Impact on Inflation and the Economy

The Producer Price Index for final demand increased 0.4% in January, with services rising 0.3% and goods advancing 0.6%. Core PPI has maintained an upward trajectory since September 2024’s 2.8%, suggesting persistent production pipeline inflation.

The U.S. Bureau of Labor Statistics reported:
Analysts at Investing.com have said:
Services for intermediate demand actually fell about 0.2% in January, you know, while processed goods increased a solid 1.0% and unprocessed goods really jumped up 5.5%. Business loans, interestingly enough, dropped a significant 7.7%, while truck transportation of freight ROSE 1.3%, revealing those varied sectoral impacts we’ve been watching.
February 2025 Data

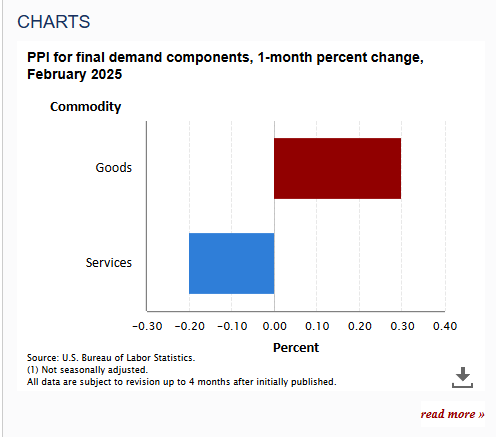
US Core PPI falls to 3.4%, which is lower than expectations. The chart shows PPI for final demand components with a 1-month percent change for February 2025. Goods registered a positive change of approximately 0.3%, while services showed a smaller increase of about 0.1%.
Market expectations for rate cuts have shifted after January’s data. The Fed faces a tougher path due to persistent producer price pressures, which typically come before consumer inflation trends that markets will watch closely in upcoming releases.

Log in to Reply
Log in to comment your thoughtsComments
Related Articles