XRP’s Ultimate Price Target: How High Can It Really Go This Cycle?

Forget the noise. The charts are telling a story—and it's one of explosive potential.
Technical analysts are mapping a path that could see XRP shatter its previous all-time high. The patterns suggest a multi-year consolidation phase is finally breaking. Key resistance levels are being tested, and each successful retest builds a stronger foundation for the next leg up.
The Bullish Setup
Look at the weekly and monthly timeframes. A massive symmetrical triangle has been forming for years. That's textbook coiling energy. The longer the compression, the more violent the eventual expansion tends to be. Fibonacci extensions drawn from the last major cycle low point to targets that would make current prices look like a distant memory.
Volume tells the real tale. Quiet accumulation has been the name of the game during the bear market. Now, breakout volume is starting to confirm the move. It's not just retail FOMO; it's a structural shift.
The Realistic Ceiling
So, what's the number? The highest projections aren't pulled from thin air. They're derived from measured moves and historical volatility. The most aggressive—yet technically valid—scenarios point to a price that would require a fundamental re-rating of the entire cross-border payments sector. Skeptics, of course, will call it hopium—the same crowd that thought the internet was a fad for sending emails.
Timing is everything. This isn't a next-week prediction. The roadmap implied by the charts unfolds over quarters, not days. It requires a sustained macro tailwind and continued adoption—the kind that makes Wall Street's legacy settlement systems look like sending a telegram.
The final take? The technicals have laid out a runway. Whether XRP's engines fire for takeoff depends on more than lines on a screen. But one thing's clear: the chart says the runway is longer than most think.
XRP Projections: Experts’ Opinions
According to Egrag Crypto, XRP’s chart is now brewing a new momentum. This momentum allows the token to beat all odds, signaling the token to hit $23. Explaining it in depth via X, Egrag Crypto claimed that the xrp price path has been following a bullish trajectory since 2013, with the third cycle top making its appearance in the form of a bull pennant in the near future.
#XRP – $3.65 Is the Valhalla Gate Key (Mini $12 – Max $23)![]()
![]() :
:
This is one of my favorite charts and it is my go-to MACRO chart for navigating #XRP’s next move.
The beauty of this chart? It locates cycle bottoms, mid-cycle tops, and cycle tops:![]() Cycle 1 (2013): Clear… https://t.co/9Iud9GNPjK pic.twitter.com/Nub3p7h1gi
Cycle 1 (2013): Clear… https://t.co/9Iud9GNPjK pic.twitter.com/Nub3p7h1gi
Another leading expert, Zach Humphries, has shared how XRP ETFs combined with the bullish market inflows may propel XRP to hit $100 in the NEAR future.
The path to $100 XRP price. Facts and fiction. pic.twitter.com/RsnZs7y3kq
— Zach Humphries (@Z_Humphries) October 6, 2025The Technical Timeline: Highest Price Threshold
According to CoinCodex XRP Stats, Ripple may surge as high as $18 by 2050, as its chart is indicative of the technical overview supporting the $18 price threshold.
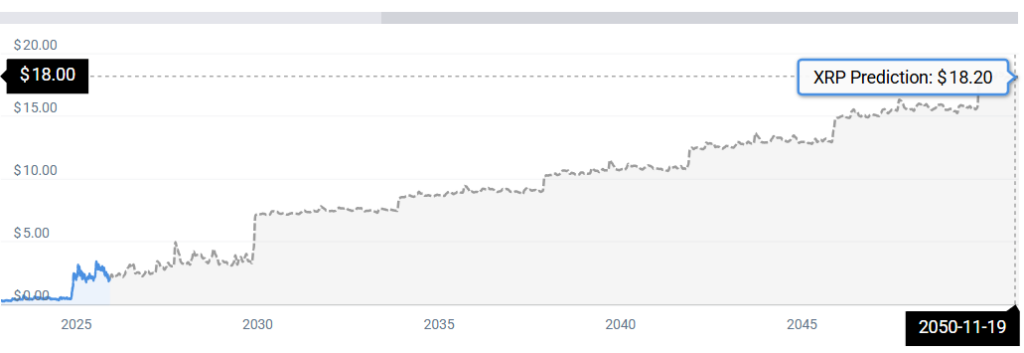
However, one must note how cryptocurrency markets are subjected to intense volatility; hence, discretion is advised before making any investment-related decisions.
