XLM Battles Resistance But Eyes $0.50 Bullish Breakout - Here’s Why It Could Surge

Stellar's native token hits a wall—but the bulls aren't backing down.
Resistance Holds Firm, For Now
XLM keeps bumping against stubborn sell pressure, yet momentum traders see a path to $0.50. No fluff, no hype—just hard technical levels and a market that's itching for the next leg up.
Targets Set, Patience Required
Break past the resistance, and suddenly that half-dollar mark doesn’t look so distant. Of course, in crypto, “soon” could mean tomorrow or three quarters from now—because when has traditional timing ever applied here?
Volatility? Standard. Opportunity? Clear.
Keep an eye on volume. Watch for the squeeze. And maybe, just maybe, ignore the usual finance bros who still think a wire transfer is innovation.
- Stellar (XLM) is trading under pressure with daily and weekly losses.
- The technical chart points to one more dip before a breakout attempt.
- Historical monthly performance highlights extreme volatility in 2024–2025.
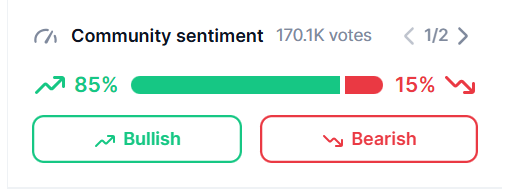
- Community sentiment remains strongly bullish despite price weakness.
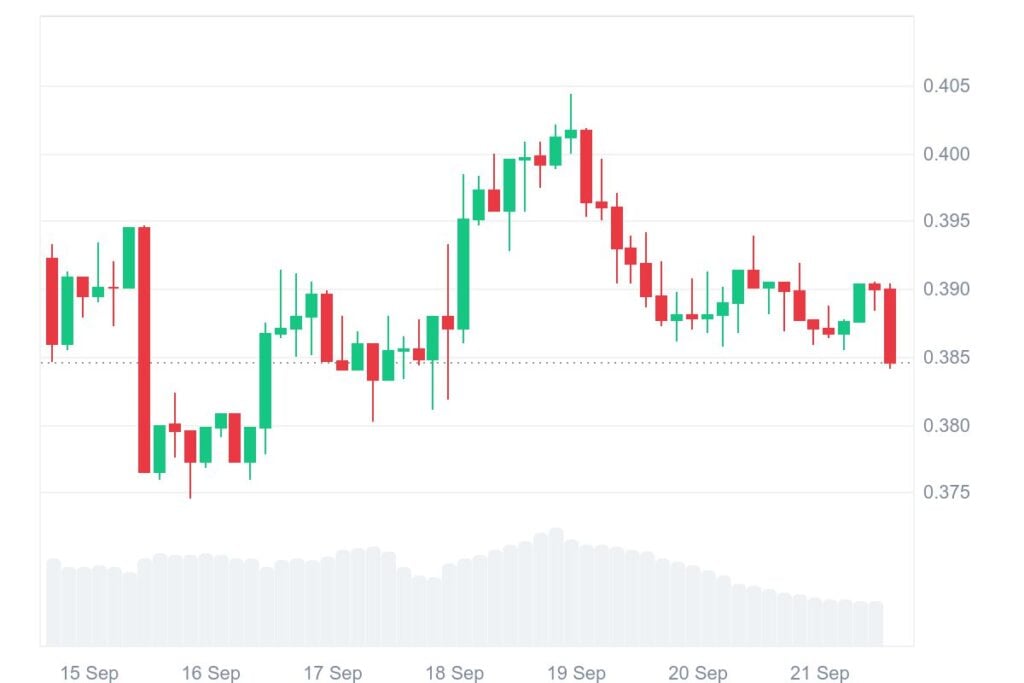
Stellar (XLM) remains under pressure as its price continues to mirror broader market sentiment. Over the last 24 hours, the token dropped by nearly 1.17%, while the past week showed a decline of 2.43%.
At the time of writing, XLM is trading at $0.3851 with a 24-hour trading volume of $158.42 million, up 11.66%. Its market capitalization stands at $12.26 billion, positioning it among notable altcoins, although it continues to face heavy resistance from sellers.
XLM Technical Setup Highlights Critical Support Levels
The chart shows XLM is trading below a descending resistance trendline that has capped movement for weeks. Sellers consistently block upward momentum, keeping the price weak. Analysts suggest the market could witness one final dip before bulls gather strength to attempt a breakout toward $0.50.
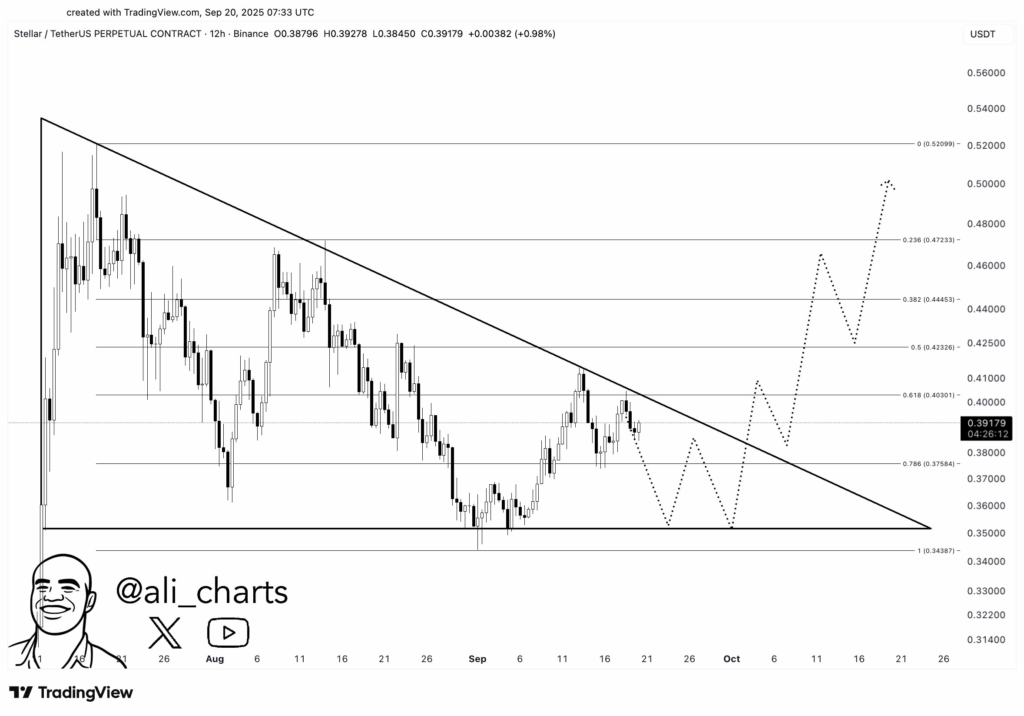
Fibonacci retracement levels provide crucial guidance on support zones. The 0.786 Fib at $0.3758 stands out as immediate support. A deeper drop could reach $0.35–$0.36, aligning with the 1.0 Fib at $0.3438, which will likely act as an accumulation zone before a potential reversal.
For bullish momentum to gain traction, XLM must close above the descending trendline and reclaim the 0.618 Fib level at $0.4030. Resistance checkpoints at $0.4232, $0.4445, and $0.4723 remain critical. Sustained moves beyond these levels could fuel an extended rally toward $0.50.
Monthly Performance Reflects High Volatility
The chart shows monthly percentage changes for 2024 and 2025, with gains in green and losses in red. In 2025, January surged by +24.6%, but February dropped by 30.9%, and losses dominated the first half. July delivered a strong +68.7% rally, followed by a -12.1% fall in August and a mild +9.09% rebound in September.
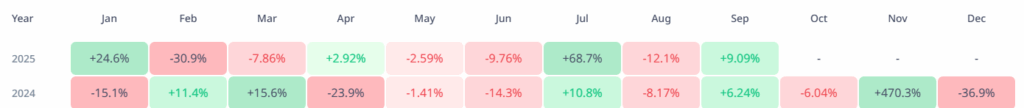
Performance in 2024 was equally volatile. It plunged by 15.1% in January, then regained ground in February and March, posting +11.4% and +15.6%. It slipped by 23.9% in April, then soared by +470.3% in November before plummeting by 36.9% in December. Stellar’s two years again showcase its extremely volatile and yo-yo-like
Sentiment and Market Volatility
Despite recent weakness, there is very bullish sentiment in the community. With 170.1K votes, nearly 85% of votes lean bullish, validating investors’ Optimism of a bullish reversal. Even historical data shows extreme volatility, and 2025 witnesses large monthly spikes.
Such volatility, paired with strong community sentiment, WOULD suggest, after temporary corrections, the long-term future of XLM is on the upside. Experts estimate a final correction will open the way up for a significant change of trend, foreshadowing a breakout up towards $0.50 and beyond.
