Cardano (ADA) Price Outlook: Resistance Near $1.00 Could Unlock Rally Toward $1.50

Cardano's ADA is knocking on the door of a major breakout—if it can just push past that stubborn $1.00 barrier.
Breaking Through the Ceiling
A clean move above a dollar isn’t just psychological; it opens up a path toward the next major target at $1.50. Traders are watching volume and momentum closely—no one wants to miss the next leg up.
Market Sentiment and Momentum
Optimism is building, but let’s be real—crypto moves fast, and sentiment can flip faster than a trader closing a leveraged position during a flash crash. Still, the setup looks promising.
What’s Next for ADA?
If buyers step up and absorb selling pressure near resistance, we could see a sharp move higher. If not? Well, welcome back to consolidationville—population: every impatient crypto investor.
One cynical take? Even if ADA rallies, someone on Crypto Twitter will still call it 'overvalued' while shilling a meme coin that launched 12 hours ago. Classic.
- Cardano is trading near $0.89, showing losses but signaling breakout potential.
- The price is retesting long-term resistance around $0.95–$1.00.
- RSI and MACD confirm growing bullish momentum.
- Community sentiment strongly favors an upward rally.
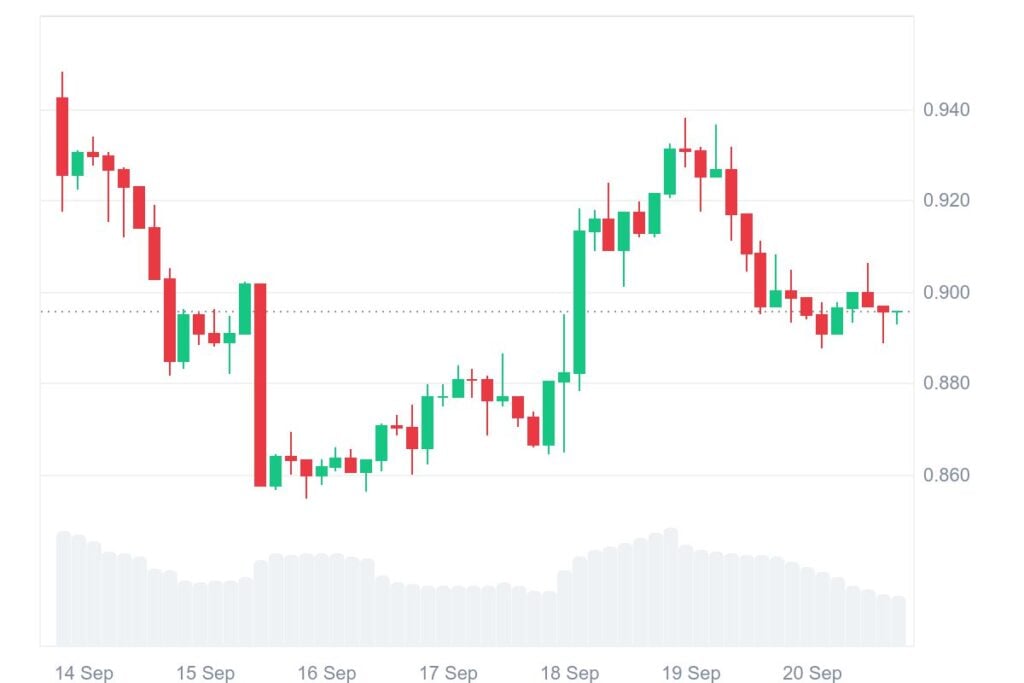
Cardano (ADA) continues to face sustained pressure while showing signs of resilience in line with the overall market. Over the past 24 hours, the token slipped 1.18%, extending its weekly decline to 5.64%.
At the time of writing, ADA is trading at $0.8928. Its trading volume has dropped by 43.71% to $1.07 billion, highlighting reduced short-term activity. Meanwhile, the market capitalization remains steady at $31.98 billion. Despite these mixed signals, ADA is holding NEAR crucial resistance levels, suggesting a possible turning point.
Cardano Chart Analysis Shows Breakout Potential Emerging
A crypto analyst highlighted that the weekly chart shows ADA at $0.8942, right against a descending resistance trendline that has repeatedly blocked rallies. This trendline, often highlighted in orange on chart setups, has capped growth for months.
Each push toward it has faced rejection, but the persistence of retests signals intensifying pressure. ADA is now trading just beneath the $0.95–$1.00 zone, which forms a crucial breakout area.
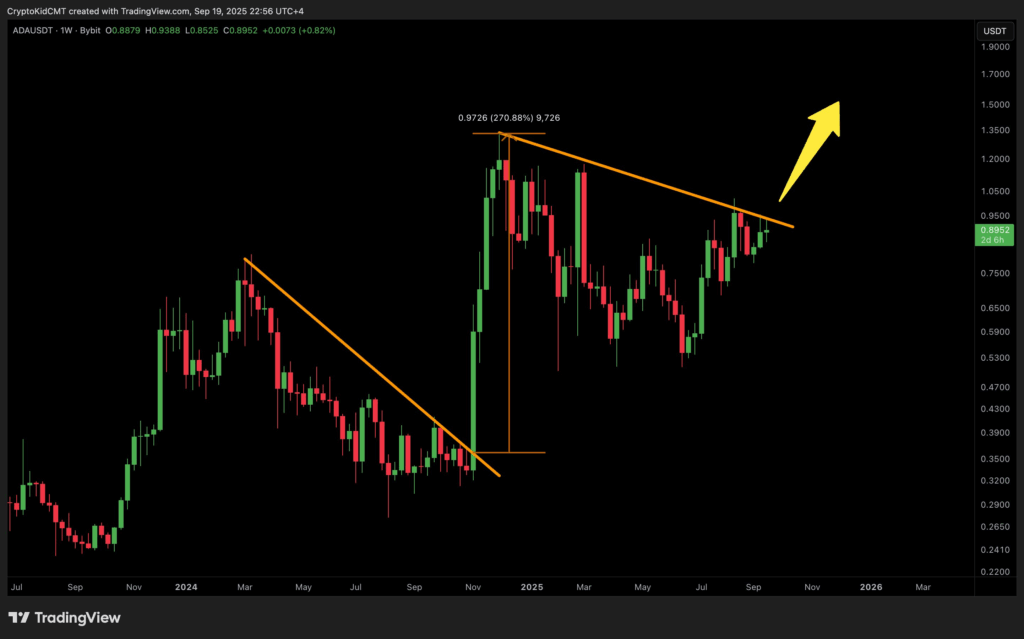
A successful close above this region WOULD represent a major shift in trend structure, opening the door for stronger bullish activity. History adds weight to this view. Current price action mirrors that structure, hinting at a possible repeat. If momentum holds, buyers may aim for $1.20, $1.35, and potentially $1.50.
RSI and MACD Indicators Signal Strength
Momentum indicators further confirm potential strength. The Relative Strength Index (RSI) stands at 56.39, above its signal line of 52.78, showing that buyers have gained control. Since RSI remains under the 70 mark, the market is not yet overbought, leaving room for further growth.
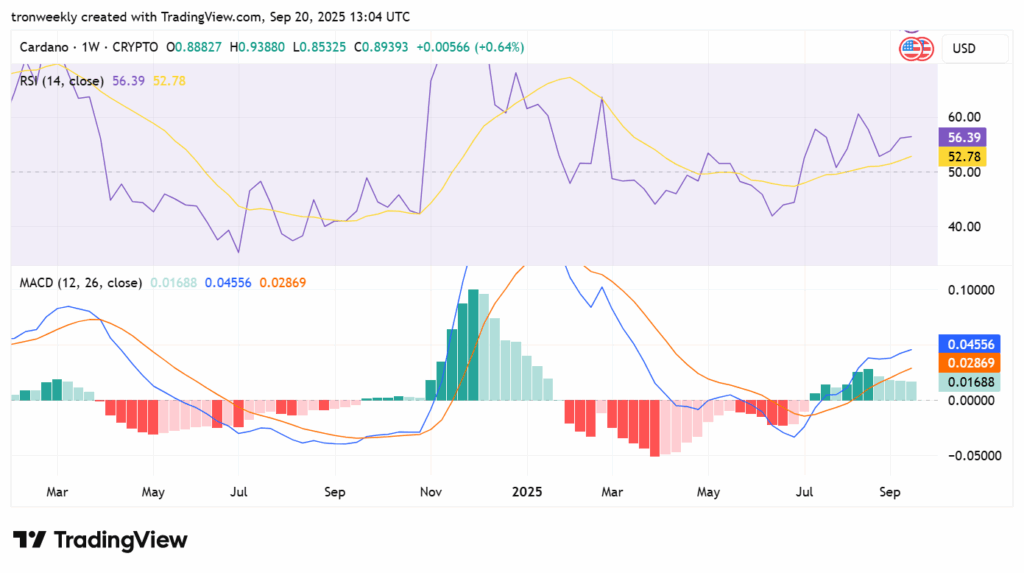
The Moving Average Convergence Divergence (MACD) gives an equally bullish opinion. The MACD is at 0.04556, above the signal line standing at 0.02869, while the histogram records a positive 0.01688. These indicators point to an uptrend on the rise, even as ADA is battling through near-term resistance.
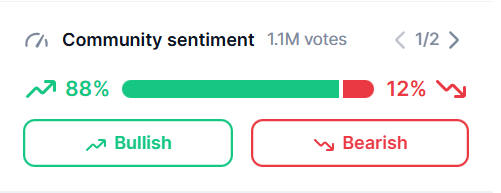
Community Market Sentiment Supports Bullish Outlook
Market sentiment also favors the bullish argument. Among the 1.1 million registered votes recorded, 88% of the participants forecast the value of ADA going up, while 12% of the participants forecast a depreciation. Such universal Optimism is an indicator of large-scale belief in the potential recovery of ADA. However, excessive sentiment is volatile if the trend stalls.
On the downside, ADA is supported immediately at $0.80, and an even deeper dip to $0.65 is feasible if resistance triggers a reversal one more time. So long as higher lows hold up, the bigger picture remains positive. The next couple of weeks might decide if ADA breaches it or encounters one other bout of rejection.
