Litecoin’s Next Move: Can LTC Shatter Its $412 All-Time High in the Coming Bull Run?

Litecoin eyes historic breakout as crypto markets heat up.
The silver to Bitcoin's gold hasn't just been sitting pretty—it's been building momentum while traditional finance plays catch-up. With institutional adoption accelerating and payment integrations expanding, LTC's fundamentals look stronger than your average banker's coffee.
Technical indicators suggest bullish alignment
Network upgrades and reduced transaction times give Litecoin an edge where it matters most: actual usability. While other coins promise revolution, LTC delivers working infrastructure—something that actually processes transactions instead of just hyping them.
Market cycles favor established assets
History doesn't repeat but it often rhymes—and Litecoin's previous bull cycles show patterns that would make any technical analyst smile. The $412 barrier isn't just a number; it's the psychological gatekeeper to uncharted territory.
Regulatory clarity could be the final catalyst
As governments stumble toward coherent crypto policies—often with the grace of a drunken bull—established coins like Litecoin stand to benefit from the chaos. Because when the dust settles, institutions flock to assets with proven track records, not meme-driven speculation.
Will Litecoin break its ATH? The charts suggest yes, but the real question is whether traditional finance will finally admit they should've bought sooner.

- MACD indicator signals a bullish trend for LTC, while the Moving Average shows the opposite
- Litecoin (LTC) is projected to reach $167 by December 2025, far below its $410 ATH
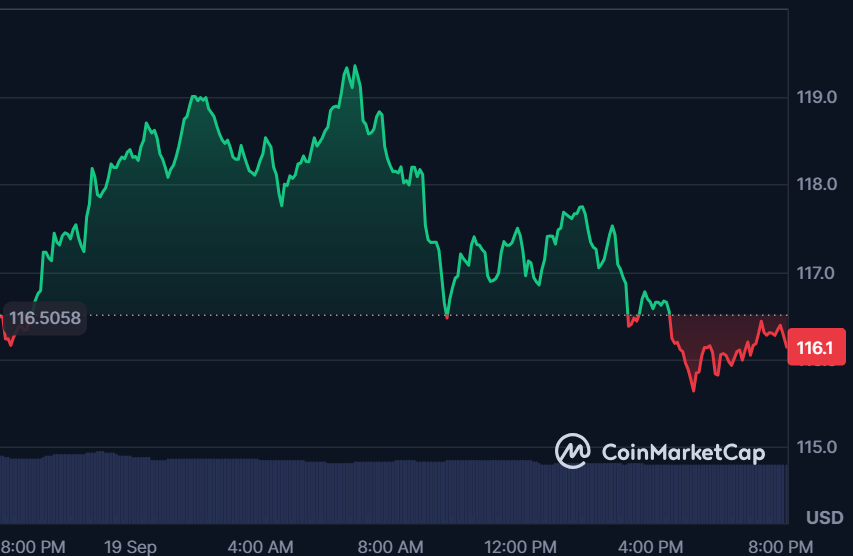
Litecoin (LTC) is experiencing significant downward momentum today, with the broader cryptocurrency market is fluctuating, according to CoinMarketCap.
Litecoin (LTC), often called the “silver to Bitcoin’s gold,” holds a market cap of about $8.86 billion and a volume of $647,21 million in the past 24 hours, highlighting its consistent presence in the cryptocurrency market. At press time, the altcoin is trading at $116.12, having decreased by 0.1% over the last 24 hours.
The price is moving in a bullish trend and is currently testing a resistance level NEAR $118.28. If it breaks above this, the next target could be $120.00. On the downside, the support level is around $115.68. If the altcoin falls below this level, we might see a drop towards $110.00.
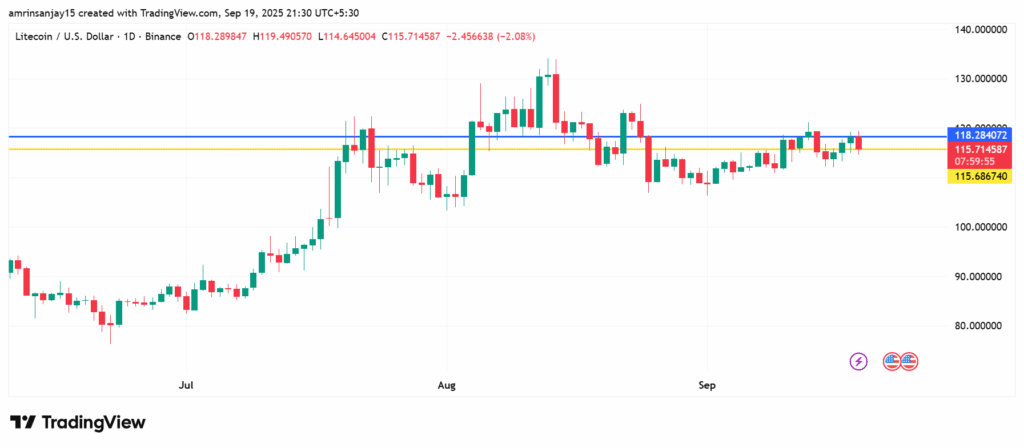
The blue line indicates the resistance level at $118.28, while the yellow line represents the support level at $115.68.
Analyzing Litecoin’s Moving Average and MACD
According to the Moving Average chart, the cryptocurrency is currently experiencing a bearish trend with the moving average indicator above the candles at $116.31. Meanwhile, Moving Average Convergence Divergence (MACD) shows a bullish crossover, suggesting that the price might keep increasing for a while.
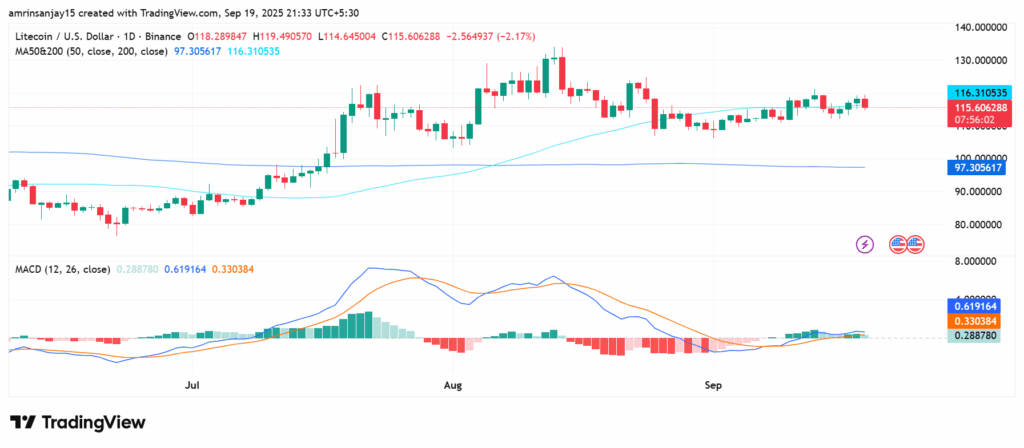
The MACD line above the signal line indicates a bullish crossover. The blue line represents the MACD line, while the orange line indicates the signal line.
Coincodex’s Prediction for Litecoin (LTC)
According to Coincodex’s current price prediction for the altcoin, the price is predicted to rise by 14.20% and reach $ 132.62 by October 19, 2025. Based on the Litecoin (LTC) forecast, it’s now a good time to buy the altcoin.
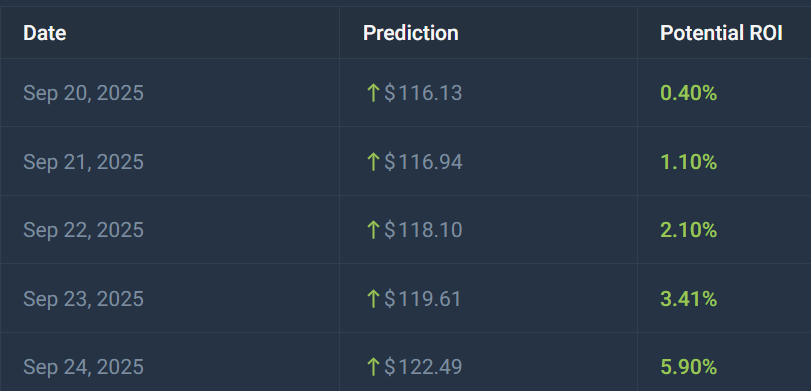
As per Coincodex data, over the next five days, the altcoin will reach the highest price of $ 122.49 on Sep 24, 2025, which WOULD represent 5.81% growth compared to the current price. This follows a -0.58% price change over the last 7 days.
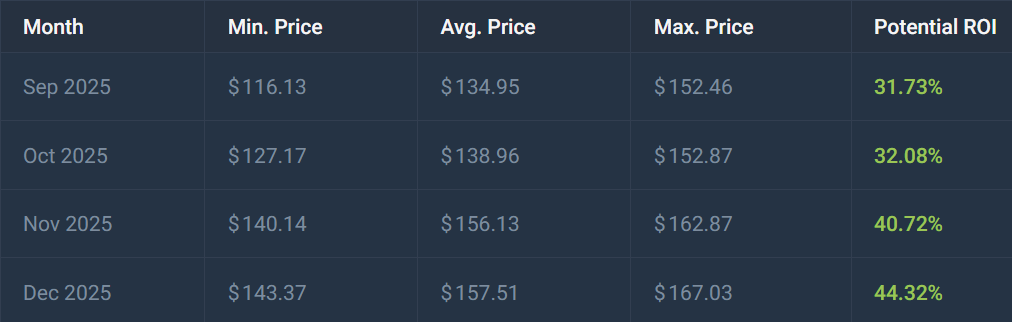
According to this chart, Litecoin (LTC) could peak at $167.03 by December 2025, which is well below its all-time high of $412.96, suggesting it is unlikely to break past its ATH in the next bull cycle.
