Pi Coin Price Prediction: PI Faces 25% Drop Risk by October 2025 - Here’s What You Need to Know

Pi Coin's price trajectory hits turbulence as analysts project significant downside pressure ahead.
Technical indicators flash warning signals across multiple timeframes, suggesting the cryptocurrency could be in for a rough ride. Market sentiment appears to be shifting, with traders positioning for potential volatility.
The 25% downside projection reflects broader market uncertainties and Pi's specific challenges in gaining mainstream adoption. While some holders remain optimistic about the project's long-term vision, short-term headwinds are mounting.
Remember—in crypto, predictions are about as reliable as a banker's promise during a bull market. Always DYOR before making any investment decisions.

- MACD indicator signals a bullish trend for Pi Coin, while the Moving Average shows the opposite
- Pi Coin is unlikely to see a bullish trend for a while, according to Coincodex.
Pi Coin (PI), the native token of the Pi Network, holds a market cap of about $2.8 billion with a 24-hour trading volume of nearly $39.21 million. Its expanding user base and unique mobile mining model continue to draw attention to the token’s price movements amid ongoing developments in the cryptocurrency market.
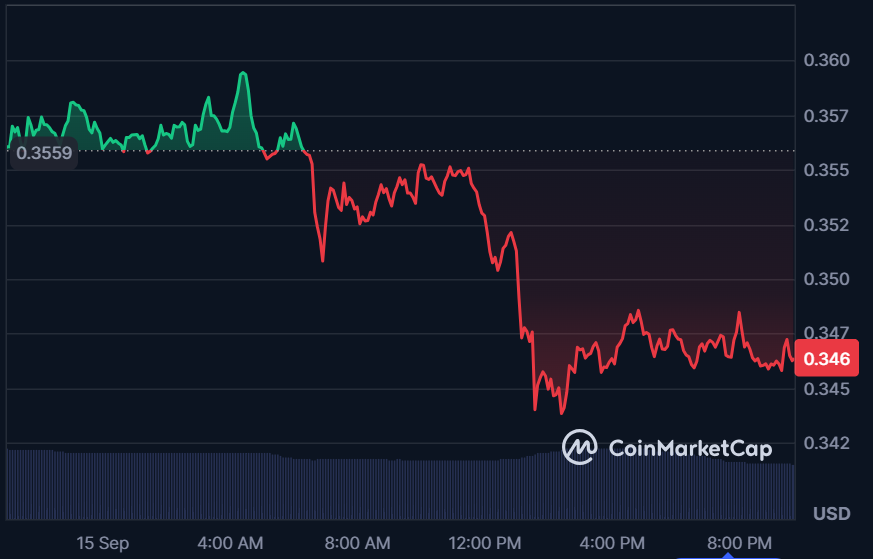
At press time, the altcoin is trading at $0.3465, having decreased by 2.96% over the past 24 hours. The price is moving in a bearish trend and is currently testing a resistance level NEAR $0.3800. If it breaks above this, the next target could be $0.4000. On the downside, the support level is around $0.3437. If the altcoin falls below this level, we might see a drop towards $0.2000.
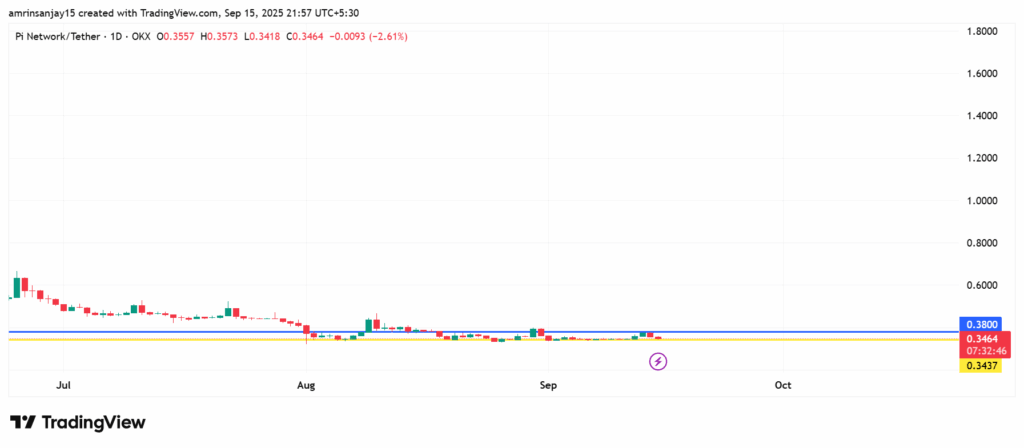
The blue line indicates the resistance level at $0.3800, while the yellow line represents the support level at $0.3437.
Analyzing Pi Coin’s Moving Average and MACD
According to the Moving Average chart, the cryptocurrency is currently experiencing a bearish trend with the moving average indicator above the candles at $0.6703. On the other hand, the Moving Average Convergence Divergence (MACD) indicates a bullish crossover, suggesting that the price may continue to increase.
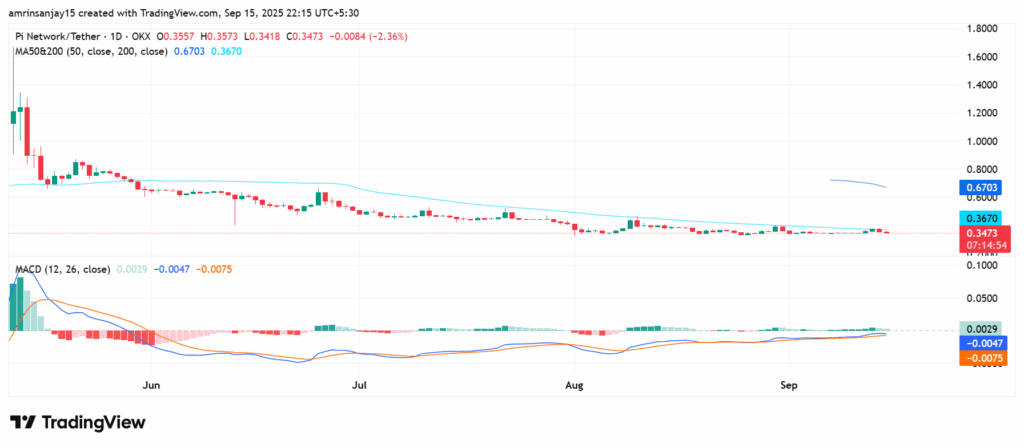
The MACD line above the signal line indicates a bullish crossover. The blue line represents the MACD line, while the orange line indicates the signal line.
September 2025 Prediction by Coincodex
According to Coincodex’s current price prediction for the altcoin, the price is predicted to drop by -25.15% and reach $ 0.260292 by October 15, 2025. Based on the Pi Coin forecast, it’s now a bad time to buy the altcoin.
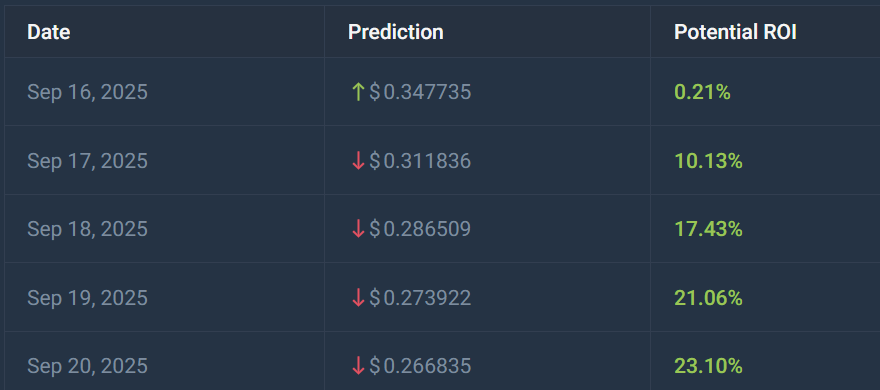
As per Coincodex data, over the next five days, the altcoin will reach the highest price of $ 0.347735 on September 16, 2025, which WOULD represent 0.21% growth compared to the current price. This follows a -0.11% price change over the last 7 days.

After a -9.47% in the past month, PI Network is predicted to fall to $ 0.276448 in September. The projected trading range is expected to span from $ 0.24261 to $ 0.347735. This suggests a negative market outlook, with a potential return of 29.94% for short buyers.
Even after the bearish sentiment in the market, people expect a bullish trend in the long term, with almost 88% of the community voting for bullish sentiment.

Based on the current outlook for September, the altcoin might be experiencing a bearish trend for a while, as technical indicators reveal signs of weakening momentum.
