Worldcoin Surges 20% This Week—Analysts Eye $2.21 Breakout as Momentum Builds

Worldcoin isn't just climbing—it's sprinting. A weekly surge has traders buzzing, with technical analysts mapping a path toward that crucial $2.21 resistance level. Break that, and we're talking serious momentum.
Why the rally?
Speculation's heating up. Maybe it's fresh institutional interest, or perhaps retail's finally waking up to the project's utility beyond the token price. Either way, volume's up, and sentiment's shifting from cautious to bullish.
What’s next?
If Worldcoin punches through $2.21, we could see a run toward previous highs. But let's be real—this is crypto. For every 'breakout,' there's a 'fakeout' waiting around the corner. Stay sharp, and maybe don’t bet the farm on a single resistance level.

- Worldcoin records a strong 78.68% weekly surge.
- The $1.52 support remains crucial for near-term stability.
- RSI and MACD indicators show improving bullish momentum.
- Resistance at $1.88 could define the next breakout path.
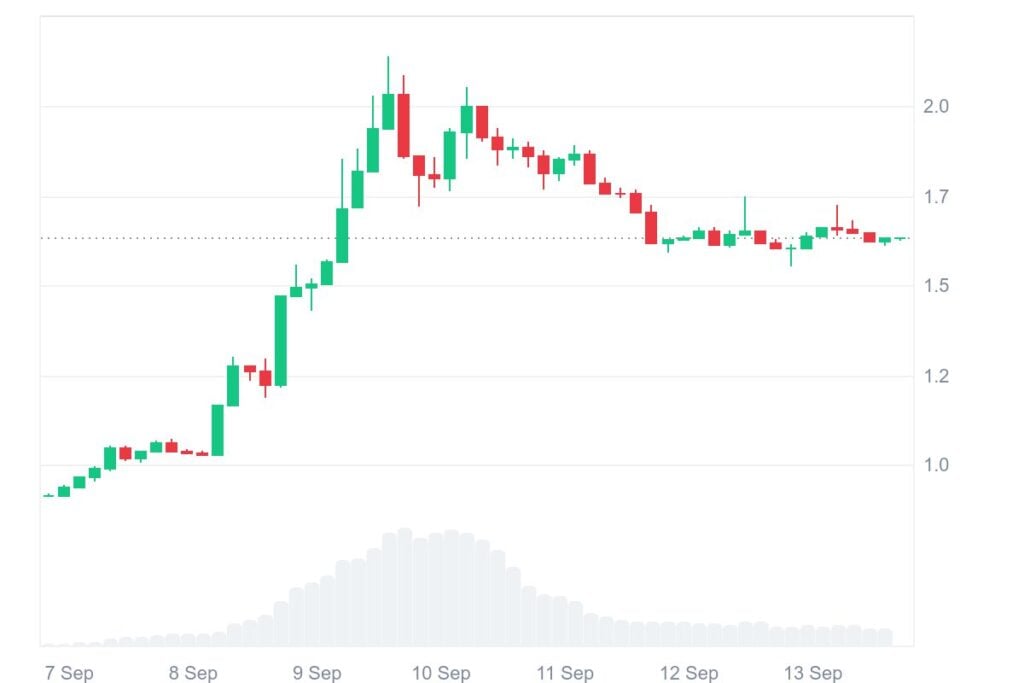
Worldcoin (WLD) shows notable strength with the surge in its price and renewed investor confidence, mirroring the broader crypto market. The token surged 78.68% in the last week, though it gained just 1.02% in the past 24 hours.
At the time of writing, Worldcoin is trading at $1.64 with a 24-hour trading volume of $676.96 million, which is down 27.34%. Its market capitalization stands at $3.28 billion, signaling strong interest from market participants.
Support and Resistance Levels Define Outlook
Worldcoin has maintained stability above the 0.5 Fibonacci retracement level at $1.52. This support has acted as a demand zone, preventing further downside pressure. As long as the token holds this area, buyers remain in control of the short-term trend.
On the upside, immediate resistance appears at $1.68, aligned with the 0.382 Fibonacci level. A breakout beyond this level could open the way toward $1.88, which corresponds with the 0.236 Fibonacci mark. This zone represents a key test for bullish traders seeking continuation toward $2.21, the recent swing high.
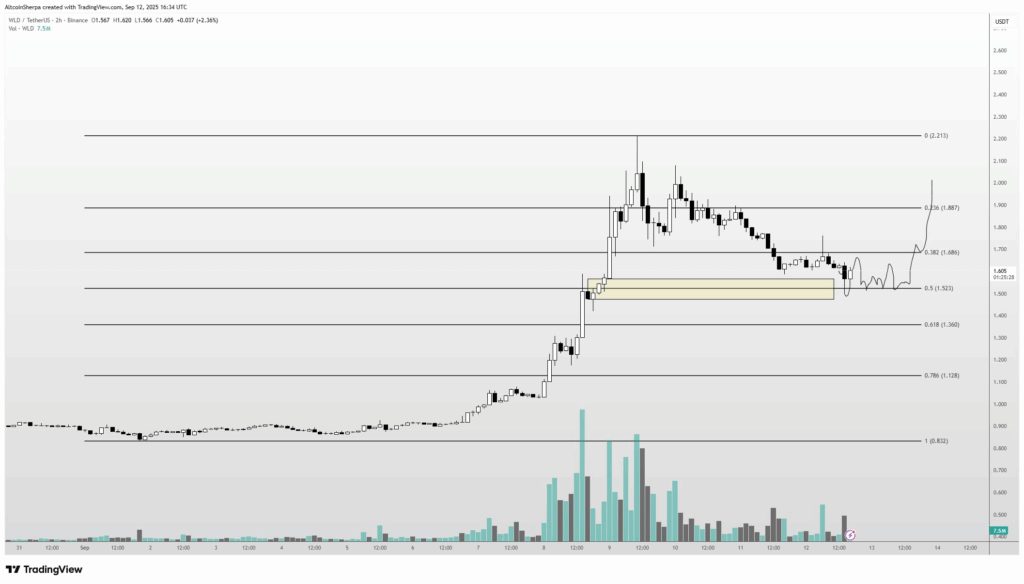
If the momentum drops and $1.52 breaks down, WLD risks dropping down to $1.36 or even $1.12, putting the token under bearish pressure. At least for now, the price activity remains in a neutral-to-bullish alignment supported by solid demand NEAR significant levels.
WLD Technical Indicators Signal Bullish Momentum
Momentum indicators support the bullish opinion. The Relative Strength Index (RSI 14) is 59.20, and the indicator’s signal line is 45.84. The sharp increase creates a distinct turning point for buying momentum, as the RSI broke the neutral 50.00 barrier. Since it remains below the 70.00 overheated barrier, the price continues to have room for a potential increase before entering an overheated area.
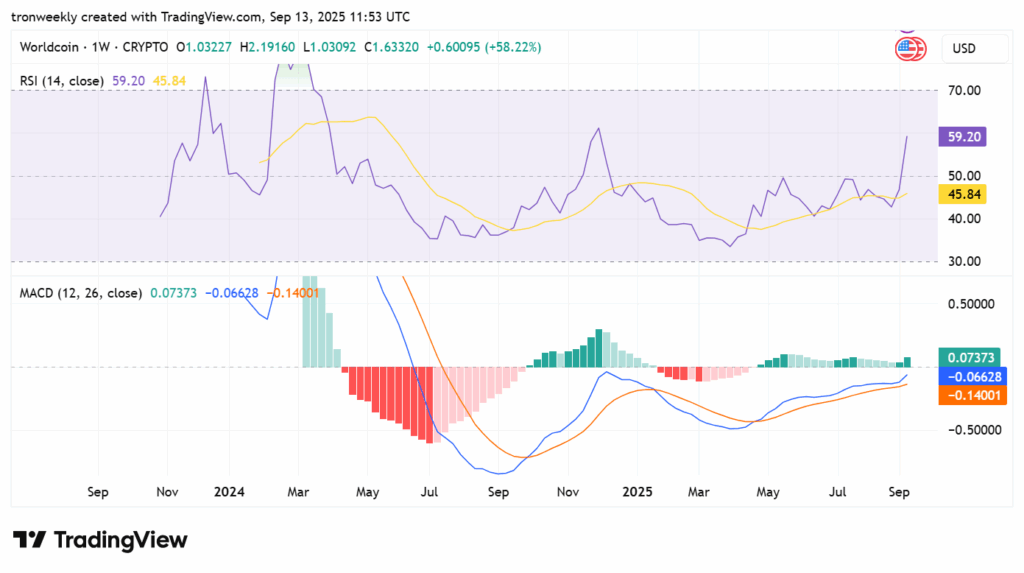
The MACD (12, 26, close) shows the MACD line at 0.07373 and the signal line at -0.06628, with the histogram at -0.14001 moving in the positive axis with expanding green bars. The bullish crossover here provides a representation of rising, strengthening upward momentum and positively shows a reversal from the long bearish trend. It also suggests the trend of the market has firmly swung in the buyers’ favor.
