PUMP Price Outlook: Bullish Momentum Accelerates Toward $0.0065 Target

PUMP surges as bullish forces gather steam—defying traditional market jitters with crypto's signature volatility.
Technical Breakout Confirmed
Momentum indicators flash green as buying pressure overwhelms resistance levels. The push toward $0.0065 isn't just hopeful speculation—it's backed by consecutive higher lows and strengthened support zones.
Market Sentiment Shifts
Traders pivot from caution to aggression as PUMP outperforms stagnant altcoins. Forget 'safe' assets—this rally feeds on pure momentum and the kind of risk appetite that gives traditional financiers night sweats.
Targets and Trajectories
Next stop: $0.0065. Beyond that, previous resistance levels turn into launchpads. Watch volume spikes—they’re the real tell, not the hype on Crypto Twitter.
Another day, another token pumping while traditional portfolios gather dust. Some things never change—and honestly, where’s the fun in stability anyway?

- Pump.fun (PUMP) gained 7.92% over the last 24 hours.
- Weekly performance shows an impressive surge of 38.88% in value.
- Trading volume rises sharply, boosting market cap to $1.61B.
- The resistance zone between $0.0048 and $0.0050 remains highly important.
Pump.fun (PUMP) continues to display resilience as the broader crypto market struggles to confirm a bullish reversal. The token is currently trading at $0.004574, reflecting a 7.92% increase over the last 24 hours. More notably, the token has surged 38.88% over the past week, highlighting strong demand and consistent buying interest.
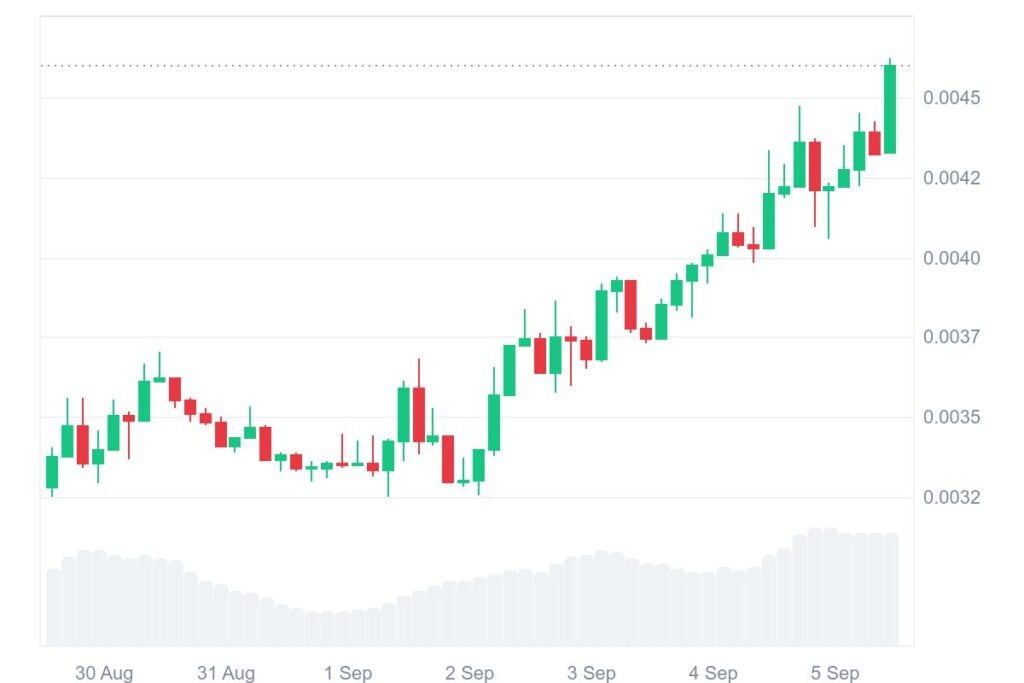
Trading activity also shows a sharp rise in market participation. The 24-hour trading volume has grown by 39.27%, now standing at $426.01 million. With its market capitalization reaching $1.61 billion, PUMP is steadily strengthening its position and gaining attention among traders looking for short-term momentum.
PUMP Technical Structure Shows a Bullish Breakout
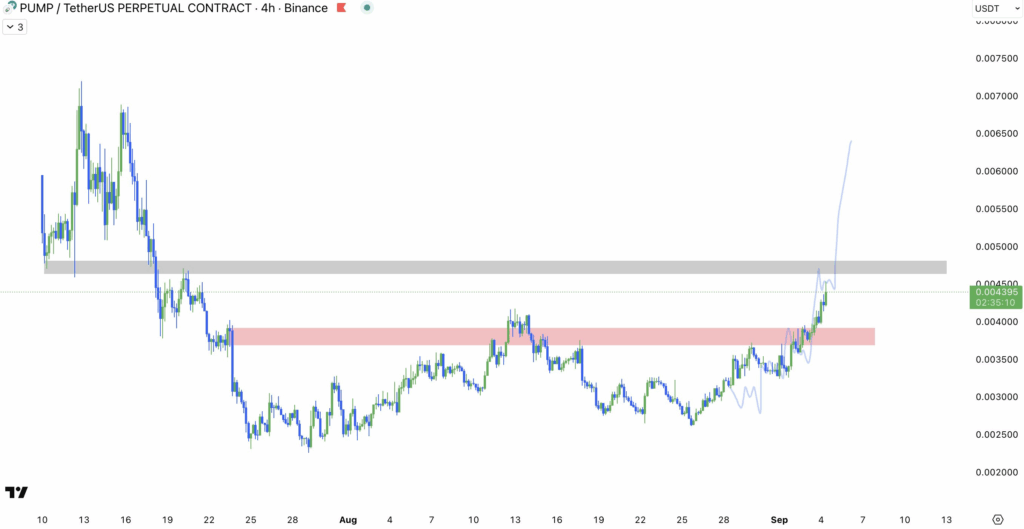
On the 4-hour price chart, a bullish breakout is clear. The token has pushed decisively above the resistance zone between $0.0038 and $0.0042. That zone previously acted as a supply barrier, but following a successful retest, it has now flipped into solid support. This structural shift confirms that buyers are in control, with higher highs and higher lows forming.
A rounded bottom pattern is visible, signaling a transition from consolidation into a full uptrend. This type of formation often marks a long-term reversal, adding weight to the ongoing bullish narrative. As the price continues climbing, traders are watching closely for reactions at the next resistance area.
According to crypto analyst BrazilZZ, the gray zone between $0.0048 and $0.0050 is critical. This region previously provided strong support before July’s sell-off and could now attract sellers again. A clean break above the area could open the doors to $0.0060–$0.0065, which coincides with the high recorded previously in mid-July.
Indicators Suggest Strong Momentum with Caution
Momentum indicators validate the current trend but also show the short-term possibility of cooling down. The Relative Strength Index (RSI) is at 71.65, which thus verifies very strong bullish pressure and also places PUMP inside the overbought territory. This creates the opportunity for slight pullbacks or sideways movement as a result of profit-taking by traders.
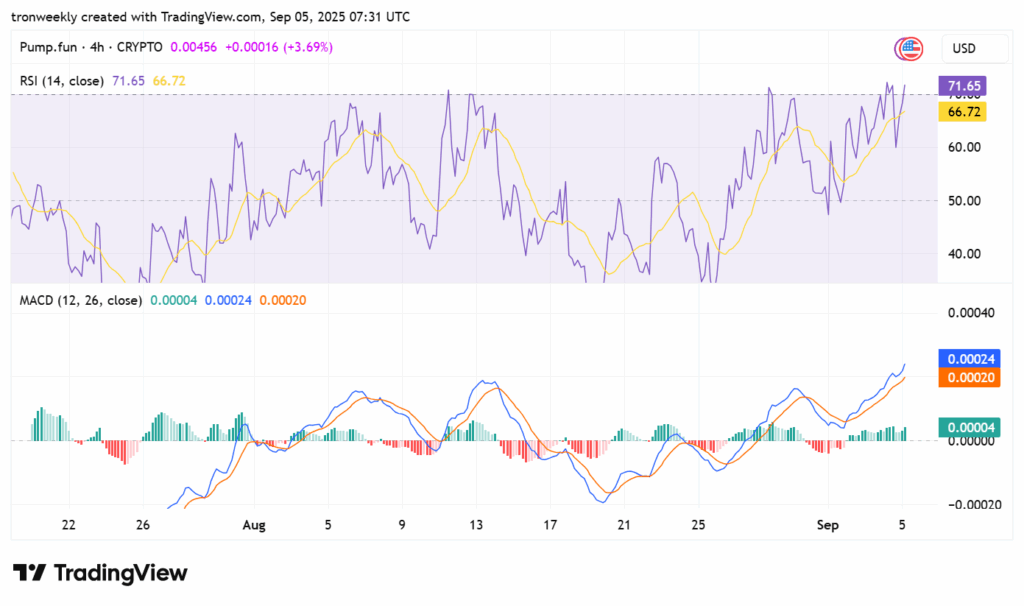
The MACD remains extremely bullish, as the MACD line has been above the signal line since September. As the histogram expanded, it indicated momentum is continuing to increase, supporting the breakout. But look for divergence between the price action and the momentum indicators, which can signal waning strength.
For now, PUMP maintains a clear advantage. A decisive MOVE above $0.0050 will probably invite more purchases and confirm the subsequent phase of the bullish trend.
