🚀 SEI Primed for Explosive Rally: $0.49 Target in Sight as Bulls Take Control

SEI's chart flashes green as traders pile into the breakout.
### The Setup: A Textbook Bull Flag Forms
After weeks of consolidation, SEI's price action coils tighter than a Wall Street banker's grip on their bonus. The $0.49 resistance level now stands as the last barrier before liftoff.
### Liquidity Hunt: Shorts About to Get Rekt?
Order books show thin liquidity above current levels—classic rocket fuel when stops start triggering. Meanwhile, perpetual funding rates remain neutral, suggesting room for speculative frenzy.
### The Cynic's Corner
Of course, this could all be another 'degen trap'—just like that NFT project your cousin won't stop shilling at Thanksgiving.
### Final Verdict: Stack or Step Back?
With volatility compressing and RSI curling upward, SEI's either breaking $0.49 or giving bagholders a new masterclass in pain. Place your bets.

- SEI is currently at $0.3296, above major MA lines; breakout to $0.49 will rally on momentum.
- The RSI is at 55.55 as the volume diminished to 33.33M to reaffirm the market’s phase of consolidation.
- Peak volume hit $169.73M with market cap at $1.91B; $0.31 remains critical support level.
SEI is now moving within a downtrending channel on its 3-day chart, indicating a short-term bear phase. In spite of this, the 10-day Simple Moving Average (SMA) provided strong support. The level is carefully monitored by the trader for bullish breakout signs.
Ali Martinez predicts that a MOVE toward the $0.49 resistance appears possible if momentum remains steady. Price action combined with the 10-day SMA support gives a cautious but optimistic outlook for SEI investors. Confirmation signals will be essential before expecting a sustained rally to $0.49.
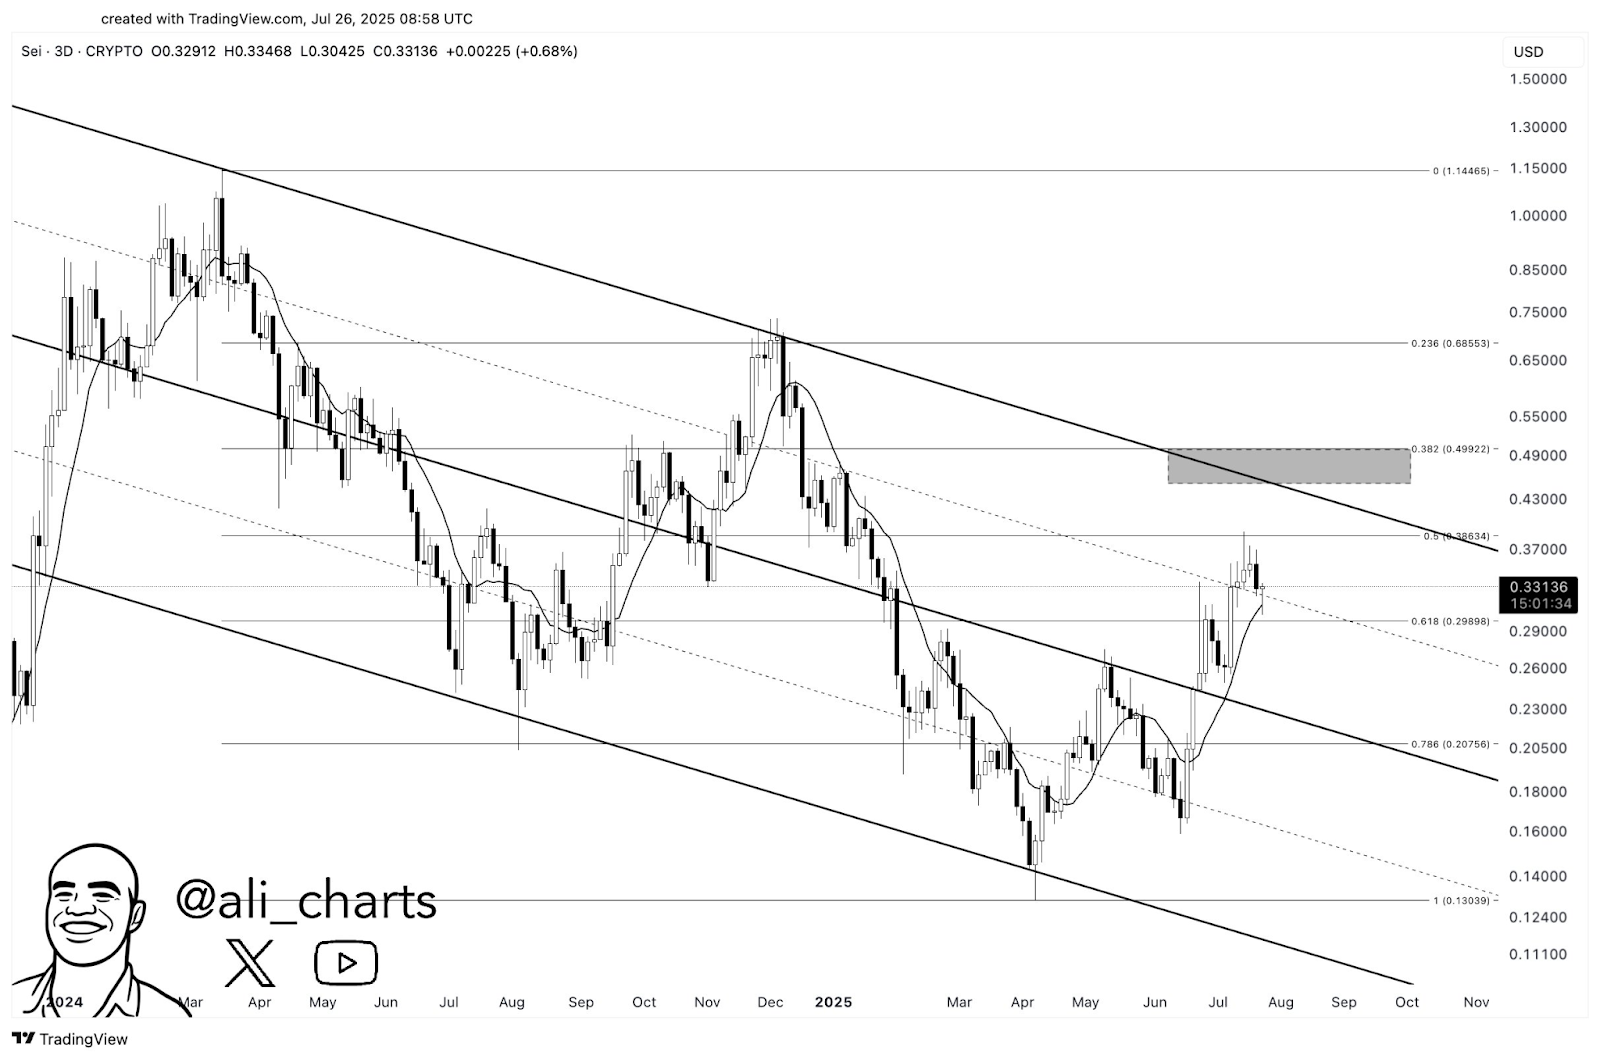
The level is positioned just above the 60-day moving average (MA60) and just below the 10-day MA to affirm medium-term support. It implies the correction is orderly with profit-taking for the recent upsurge which peaked around $0.39 earlier this month of July.
Consolidation Pattern Indicates Possible Breakout
Recent price action reveals smaller candle bodies and tighter trading ranges, suggesting market indecision instead of strong selling pressure. The 24-hour volume dropped to 33.33 million SEI from highs above 100 million, indicating market fatigue but no forced selling.
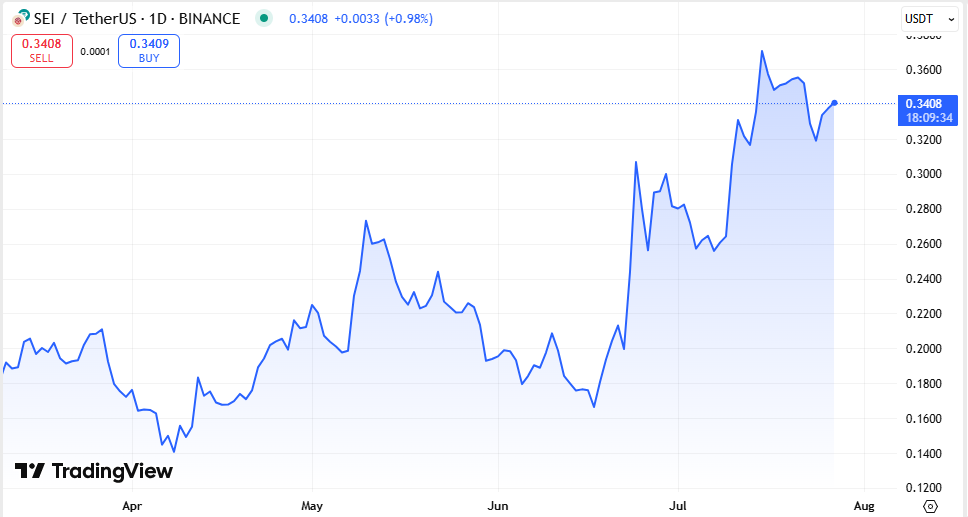
SEI ROSE by 5.32% for the entire week-long session before giving up ground. The price momentarily rose from $0.31 to $0.33 by breaking marked resistance. The spike touched an intraday high volume of $169.73 million and took the market cap to $1.91 billion.
If the volume gets back to over $0.35, it could set up the next leg up. The lack of forced selling is one sign that the buying is still dominant for the direction of the market. A breakout with confirmation could build new bullish momentum for the short term.

SEI Faces Key Support Near $0.31
SEI is currently exchanging around $0.3408 with the Relative Strength Index (RSI) at 55.55. The moving average based on the RSI is higher at 63.82, with the momentum having moderated but staying above the 50 midline. RSI between 50 and 60 is commonly the zone of consolidation inside a current uptrend. Bullish strength might be regained if RSI stabilizes and rises.
If the price persists above the 30-day MA and the RSI continues to increase, the Sei may again seek $0.36 to $0.39. If the price declines below $0.31, the support zone of $0.28 to $0.29 may again be tested. For the new direction, the traders must strictly observe these important technical levels.
